Burger King 2009 Annual Report Download - page 111
Download and view the complete annual report
Please find page 111 of the 2009 Burger King annual report below. You can navigate through the pages in the report by either clicking on the pages listed below, or by using the keyword search tool below to find specific information within the annual report.-
 1
1 -
2
-
3
-
4
-
5
-
6
-
7
-
8
-
9
-
10
-
11
-
12
-
13
-
14
-
15
-
16
-
17
-
18
-
19
-
20
-
21
-
22
-
23
-
24
-
25
-
26
-
27
-
28
-
29
-
30
-
31
-
32
-
33
-
34
-
35
-
36
-
37
-
38
-
39
-
40
-
41
-
42
-
43
-
44
-
45
-
46
-
47
-
48
-
49
-
50
-
51
-
52
-
53
-
54
-
55
-
56
-
57
-
58
-
59
-
60
-
61
-
62
-
63
-
64
-
65
-
66
-
67
-
68
-
69
-
70
-
71
-
72
-
73
-
74
-
75
-
76
-
77
-
78
-
79
-
80
-
81
-
82
-
83
-
84
-
85
-
86
-
87
-
88
-
89
-
90
-
91
-
92
-
93
-
94
-
95
-
96
-
97
-
98
-
99
-
100
-
 101
101 -
 102
102 -
 103
103 -
 104
104 -
 105
105 -
 106
106 -
 107
107 -
 108
108 -
 109
109 -
 110
110 -
 111
111 -
 112
112 -
 113
113 -
 114
114 -
 115
115 -
 116
116 -
 117
117 -
 118
118 -
 119
119 -
 120
120 -
 121
121 -
122
-
123
-
124
-
125
-
126
-
127
-
128
-
129
-
130
-
131
-
132
-
133
-
134
-
135
-
136
-
137
-
138
-
139
-
140
-
141
-
142
-
143
-
144
-
145
-
146
-
147
-
148
-
149
-
150
-
151
-
152
-
153
-
154
-
155
-
156
-
157
-
158
-
159
-
160
-
161
-
162
-
163
-
164
-
165
-
166
-
167
-
168
-
169
-
170
-
171
-
172
-
173
-
174
-
175
-
176
-
177
-
178
-
179
-
180
-
181
-
182
-
183
-
184
-
185
-
186
-
187
-
188
-
189
-
190
-
191
-
192
-
193
-
194
-
195
-
196
-
197
-
198
-
199
-
200
-
201
-
202
-
203
-
204
-
205
-
206
-
207
-
208
-
209
-
210
-
211
-
212
-
213
-
214
-
215
-
216
-
217
-
218
-
219
-
220
-
221
-
222
-
223
-
224
-
225
 |
 |

Table of Contents
BURGER KING HOLDINGS, INC. AND SUBSIDIARIES
Notes to Consolidated Financial Statements — (Continued)
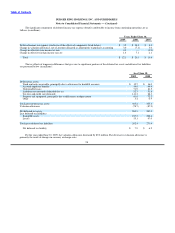
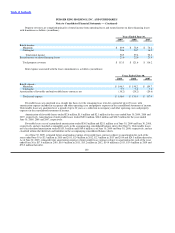
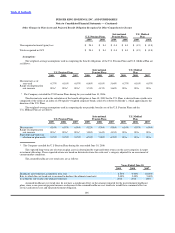
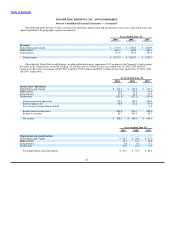
Note 20. Other Operating (Income) Expenses, Net
Other operating (income) expenses, net, consist of the following (in millions):
Years Ended June 30,
2009 2008 2007
Net gains on refranchisings, dispositions of assets and restaurant closures $ (8.5) $ (9.8) $ (4.7)
Impairment of fixed assets 0.5 — —
Litigation settlements and accruals 3.2 1.1 1.7
Other, net 10.6 9.6 (1.4)
Other operating (income) expenses, net $ 5.8 $ 0.9 $ (4.4)
The $10.6 million of other, net within other operating (income) expenses, net for the year ended June 30, 2009 includes a
$6.8 million of net expense related to the remeasurement of foreign denominated assets and the expense related to the use of foreign
currency forward contracts used to hedge the currency exchange impact on such assets, and $3.9 million of net losses on investments
held in the rabbi trust, which were fully offset by a corresponding decrease in deferred compensation expense reflected in general and
administrative expenses.
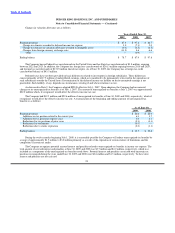
The $9.6 million of other, net within other operating (income) expenses, net for the year ended June 30, 2008 includes
$4.2 million of franchise system distress costs in the U.K., $1.6 million of foreign currency transaction losses, $1.9 million of settlement
losses associated with the acquisition of franchise restaurants and a loss of $0.7 million from forward currency contracts used to hedge
intercompany loans denominated in foreign currencies.
The $1.4 million of other, net within other operating (income) expenses, net for the year ended June 30, 2007 included a realized
gain of $6.8 million from forward currency contracts used to hedge intercompany loans denominated in foreign currencies and a
$3.4 million gain resulting from the reclassification of the foreign exchange gain on foreign denominated deferred tax assets (See
Note 2), offset by $6.6 million in costs associated with the lease termination of the Company’s proposed new headquarters, and
$2.9 million in franchise workout costs.
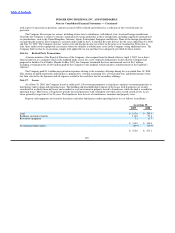
Note 21. Commitments and Contingencies
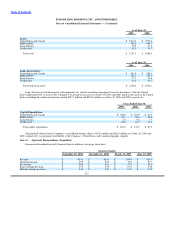
Franchisee Restructuring Program
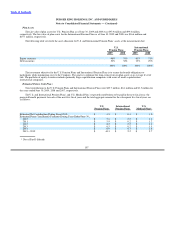
During the year ended June 30, 2003, the Company initiated a program designed to provide financial assistance to franchisees in
the United States and Canada experiencing financial difficulties. Under this program, the Company worked with franchisees meeting
certain operational criteria, their lenders, and other creditors to attempt to strengthen the franchisees’ financial condition.
In order to assist certain franchisees in making capital improvements to their restaurants, the Company has provided loans to such
franchisees to fund capital expenditures (“Capex Loans”). Capex Loans are typically unsecured, bear interest, and have 10−year terms.
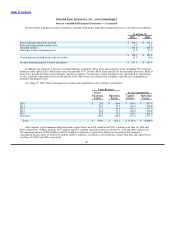
In addition, the Company has made capital improvements related to restaurant properties that the Company leases to franchisees.
During the years ended June 30, 2009, 2008, and 2007, the Company funded $1.1 million, $0.9 million and $3.5 million of Capex loans,
respectively. During the years ended June 30, 2009, 2008 and 2007, the Company made $2.3 million, $2.5 million and $2.7 million in
improvements to restaurant properties that the Company leases to franchisees, respectively. As of June 30, 2009, the Company had
commitments to fund future Capex loans of less than $1.0 million and to make up to $4.3 million of improvements to restaurant
properties that the Company leases to franchisees. These commitments extend over a period of up to two years.
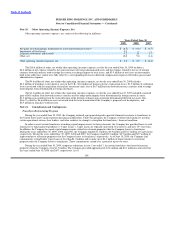
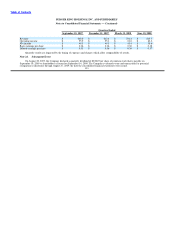
During the year ended June 30, 2009, temporary reductions in rent (“rent relief”) for certain franchisees that leased restaurant
properties from the Company were $1.5 million. The Company provided approximately $1.8 million and $2.1 million in rent relief for
the years ended June 30, 2008 and 2007, respectively. As of
108