Burger King 2009 Annual Report Download - page 79
Download and view the complete annual report
Please find page 79 of the 2009 Burger King annual report below. You can navigate through the pages in the report by either clicking on the pages listed below, or by using the keyword search tool below to find specific information within the annual report.-
 1
1 -
2
-
3
-
4
-
5
-
6
-
7
-
8
-
9
-
10
-
11
-
12
-
13
-
14
-
15
-
16
-
17
-
18
-
19
-
20
-
21
-
22
-
23
-
24
-
25
-
26
-
27
-
28
-
29
-
30
-
31
-
32
-
33
-
34
-
35
-
36
-
37
-
38
-
39
-
40
-
41
-
42
-
43
-
44
-
45
-
46
-
47
-
48
-
49
-
50
-
51
-
52
-
53
-
54
-
55
-
56
-
57
-
58
-
59
-
60
-
61
-
62
-
63
-
64
-
65
-
66
-
67
-
68
-
 69
69 -
 70
70 -
 71
71 -
 72
72 -
 73
73 -
 74
74 -
 75
75 -
 76
76 -
 77
77 -
 78
78 -
 79
79 -
 80
80 -
 81
81 -
 82
82 -
 83
83 -
 84
84 -
 85
85 -
 86
86 -
 87
87 -
 88
88 -
 89
89 -
90
-
91
-
92
-
93
-
94
-
95
-
96
-
97
-
98
-
99
-
100
-
101
-
102
-
103
-
104
-
105
-
106
-
107
-
108
-
109
-
110
-
111
-
112
-
113
-
114
-
115
-
116
-
117
-
118
-
119
-
120
-
121
-
122
-
123
-
124
-
125
-
126
-
127
-
128
-
129
-
130
-
131
-
132
-
133
-
134
-
135
-
136
-
137
-
138
-
139
-
140
-
141
-
142
-
143
-
144
-
145
-
146
-
147
-
148
-
149
-
150
-
151
-
152
-
153
-
154
-
155
-
156
-
157
-
158
-
159
-
160
-
161
-
162
-
163
-
164
-
165
-
166
-
167
-
168
-
169
-
170
-
171
-
172
-
173
-
174
-
175
-
176
-
177
-
178
-
179
-
180
-
181
-
182
-
183
-
184
-
185
-
186
-
187
-
188
-
189
-
190
-
191
-
192
-
193
-
194
-
195
-
196
-
197
-
198
-
199
-
200
-
201
-
202
-
203
-
204
-
205
-
206
-
207
-
208
-
209
-
210
-
211
-
212
-
213
-
214
-
215
-
216
-
217
-
218
-
219
-
220
-
221
-
222
-
223
-
224
-
225
 |
 |

Table of Contents
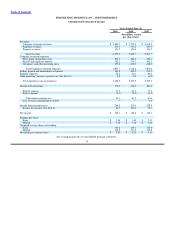
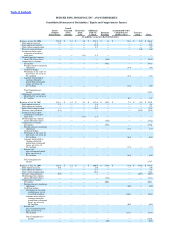
BURGER KING HOLDINGS, INC. AND SUBSIDIARIES
Consolidated Statements of Cash Flows
Years Ended June 30,
2009 2008 2007
(In millions)
Cash flows from operating activities:
Net income $ 200.1 $ 189.6 $ 148.1
Adjustments to reconcile net income to net cash provided by operating activities:
Depreciation and amortization 98.1 95.6 88.8
Impairment of long−lived assets 0.5 — —
Gain on hedging activities (1.3) (2.0) (3.9)
Loss (gain) on remeasurement of foreign denominated transactions 50.1 (55.6) (26.2)
Gain on refranchisings and dispositions of assets (11.0) (16.8) (11.4)
Bad debt expense net of recoveries 0.7 (2.7) (4.4)
Loss on early extinguishment of debt — — 1.3
Stock−based compensation 16.2 11.4 4.9
Deferred income taxes 12.1 20.3 13.6
Changes in current assets and liabilities, excluding acquisitions and dispositions:
Trade and notes receivable 2.1 (8.6) (13.2)
Prepaids and other current assets (35.4) 14.9 (16.7)
Accounts and drafts payable 3.3 20.8 5.0
Accrued advertising (7.7) 11.1 14.4
Other accrued liabilities (20.8) (6.2) (101.4)
Other long−term assets and liabilities, net 3.8 (28.4) 11.5
Net cash provided by operating activities 310.8 243.4 110.4
Cash flows from investing activities:
Purchases of available−for−sale securities — — (349.9)
Proceeds from sale of available−for−sale securities — — 349.9
Payments for property and equipment (204.0) (178.2) (87.3)
Proceeds from refranchisings, disposition of assets and restaurant closures 26.4 27.0 22.0
Payments for acquired franchisee operations, net of cash acquired (67.9) (54.2) (16.9)
Return of investment on direct financing leases 7.9 7.4 6.7
Other investing activities (4.4) (1.3) (1.9)
Net cash used for investing activities (242.0) (199.3) (77.4)
Cash flows from financing activities:
Repayments of term debt and capital leases (7.4) (55.5) (130.8)
Borrowings under revolving credit facility and other 94.3 50.0 0.7
Repayments of revolving credit facility (144.3) — —
Proceeds from stock option exercises 3.0 3.8 8.2
Dividends paid on common stock (34.1) (34.2) (16.9)
Excess tax benefits from stock−based compensation 3.3 9.3 13.5
Repurchases of common stock (20.3) (35.4) (1.6)
Net cash used for financing activities (105.5) (62.0) (126.9)
Effect of exchange rates on cash and cash equivalents (7.6) 14.4 4.6
Decrease in cash and cash equivalents (44.3) (3.5) (89.3)
Cash and cash equivalents at beginning of year 166.0 169.5 258.8
Cash and cash equivalents at end of year $ 121.7 $ 166.0 $ 169.5
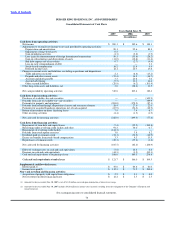
Supplemental cashflow disclosures:
Interest paid(1) $ 56.0 $ 64.6 $ 61.0
Income taxes paid(2) $ 112.3 $ 73.5 $ 150.6
Non−cash investing and financing activities:
Acquisition of property with capital lease obligations $ 2.2 $ 9.3 $ 8.0
Net investment in direct financing leases $ 12.2 $ 2.3 $ 2.5
(1) Amount for the year ended June 30, 2007 is net of $13.0 million received upon termination of interest rate swaps.
(2) Amount for the year ended June 30, 2007 includes $82.0 million in income taxes incurred, resulting from the realignment of the Company’s European and
Asian businesses.
See accompanying notes to consolidated financial statements.
76