Burger King 2009 Annual Report Download - page 40
Download and view the complete annual report
Please find page 40 of the 2009 Burger King annual report below. You can navigate through the pages in the report by either clicking on the pages listed below, or by using the keyword search tool below to find specific information within the annual report.-
 1
1 -
2
-
3
-
4
-
5
-
6
-
7
-
8
-
9
-
10
-
11
-
12
-
13
-
14
-
15
-
16
-
17
-
18
-
19
-
20
-
21
-
22
-
23
-
24
-
25
-
26
-
27
-
28
-
29
-
 30
30 -
 31
31 -
 32
32 -
 33
33 -
 34
34 -
 35
35 -
 36
36 -
 37
37 -
 38
38 -
 39
39 -
 40
40 -
 41
41 -
 42
42 -
 43
43 -
 44
44 -
 45
45 -
 46
46 -
 47
47 -
 48
48 -
 49
49 -
 50
50 -
51
-
52
-
53
-
54
-
55
-
56
-
57
-
58
-
59
-
60
-
61
-
62
-
63
-
64
-
65
-
66
-
67
-
68
-
69
-
70
-
71
-
72
-
73
-
74
-
75
-
76
-
77
-
78
-
79
-
80
-
81
-
82
-
83
-
84
-
85
-
86
-
87
-
88
-
89
-
90
-
91
-
92
-
93
-
94
-
95
-
96
-
97
-
98
-
99
-
100
-
101
-
102
-
103
-
104
-
105
-
106
-
107
-
108
-
109
-
110
-
111
-
112
-
113
-
114
-
115
-
116
-
117
-
118
-
119
-
120
-
121
-
122
-
123
-
124
-
125
-
126
-
127
-
128
-
129
-
130
-
131
-
132
-
133
-
134
-
135
-
136
-
137
-
138
-
139
-
140
-
141
-
142
-
143
-
144
-
145
-
146
-
147
-
148
-
149
-
150
-
151
-
152
-
153
-
154
-
155
-
156
-
157
-
158
-
159
-
160
-
161
-
162
-
163
-
164
-
165
-
166
-
167
-
168
-
169
-
170
-
171
-
172
-
173
-
174
-
175
-
176
-
177
-
178
-
179
-
180
-
181
-
182
-
183
-
184
-
185
-
186
-
187
-
188
-
189
-
190
-
191
-
192
-
193
-
194
-
195
-
196
-
197
-
198
-
199
-
200
-
201
-
202
-
203
-
204
-
205
-
206
-
207
-
208
-
209
-
210
-
211
-
212
-
213
-
214
-
215
-
216
-
217
-
218
-
219
-
220
-
221
-
222
-
223
-
224
-
225
 |
 |
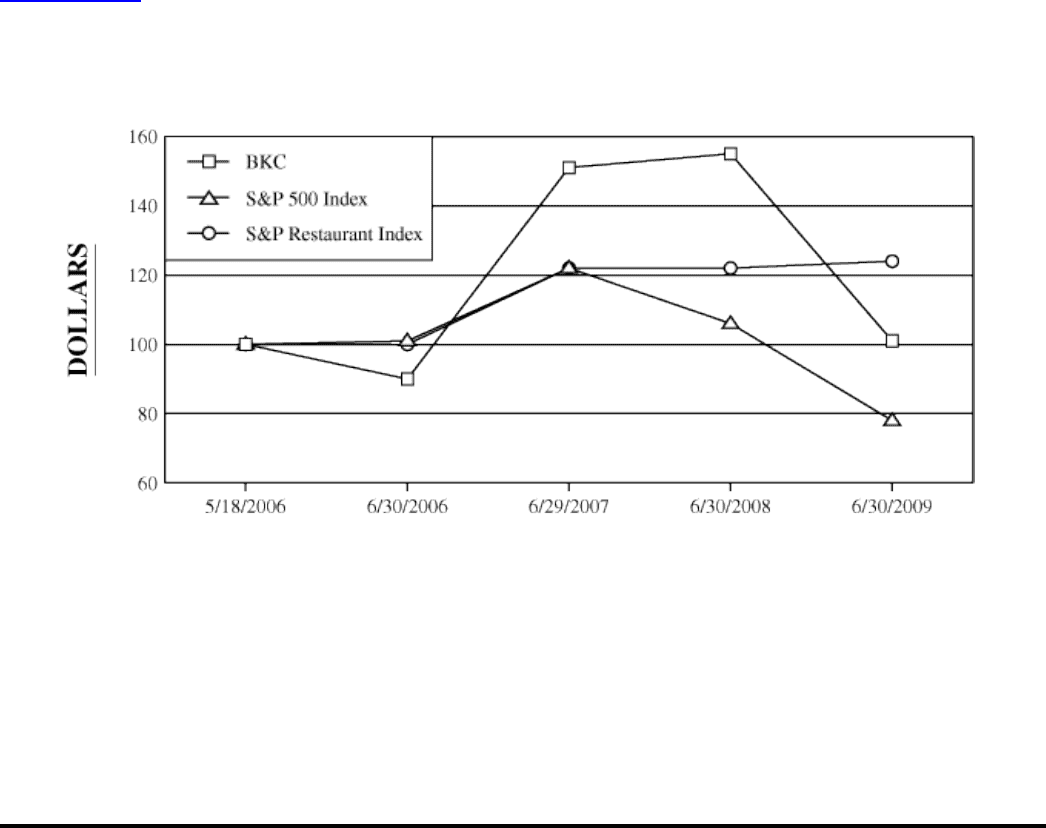
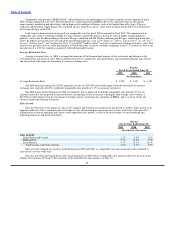
Table of Contents
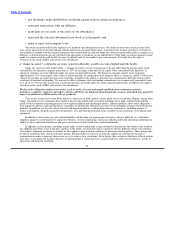
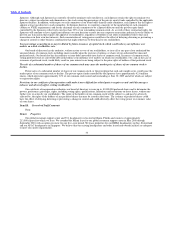
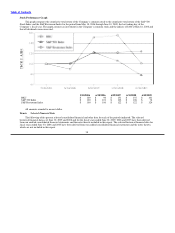
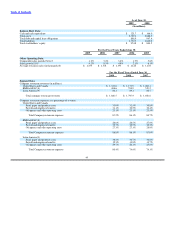
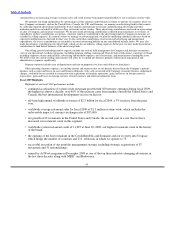
Stock Performance Graph
This graph compares the cumulative total return of the Company’s common stock to the cumulative total return of the S&P 500
Stock Index and the S&P Restaurant Index for the period from May 18, 2006 through June 30, 2009, the last trading day of the
Company’s fiscal year. The graph assumes an investment in the Company’s common stock and the indices of $100 at May 18, 2006 and
that all dividends were reinvested.
5/18/2006 6/30/2006 6/29/2007 6/30/2008 6/30/2009
BKC $ 100 $ 90 $ 151 $ 155 $ 101
S&P 500 Index $ 100 $ 101 $ 122 $ 106 $ 78
S&P Restaurant Index $ 100 $ 100 $ 122 $ 122 $ 124
All amounts rounded to nearest dollar.
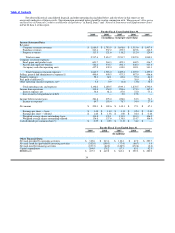
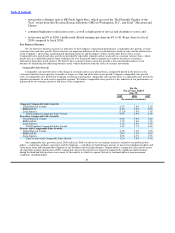
Item 6. Selected Financial Data
The following tables present selected consolidated financial and other data for each of the periods indicated. The selected
historical financial data as of June 30, 2009 and 2008 and for the fiscal years ended June 30, 2009, 2008 and 2007 have been derived
from our audited consolidated financial statements and the notes thereto included in this report. The selected historical financial data for
fiscal years ended June 30, 2006 and 2005 have been derived from our audited consolidated financial statements and the notes thereto,
which are not included in this report.
38