Burger King 2009 Annual Report Download - page 42
Download and view the complete annual report
Please find page 42 of the 2009 Burger King annual report below. You can navigate through the pages in the report by either clicking on the pages listed below, or by using the keyword search tool below to find specific information within the annual report.-
 1
1 -
2
-
3
-
4
-
5
-
6
-
7
-
8
-
9
-
10
-
11
-
12
-
13
-
14
-
15
-
16
-
17
-
18
-
19
-
20
-
21
-
22
-
23
-
24
-
25
-
26
-
27
-
28
-
29
-
30
-
31
-
 32
32 -
 33
33 -
 34
34 -
 35
35 -
 36
36 -
 37
37 -
 38
38 -
 39
39 -
 40
40 -
 41
41 -
 42
42 -
 43
43 -
 44
44 -
 45
45 -
 46
46 -
 47
47 -
 48
48 -
 49
49 -
 50
50 -
 51
51 -
 52
52 -
53
-
54
-
55
-
56
-
57
-
58
-
59
-
60
-
61
-
62
-
63
-
64
-
65
-
66
-
67
-
68
-
69
-
70
-
71
-
72
-
73
-
74
-
75
-
76
-
77
-
78
-
79
-
80
-
81
-
82
-
83
-
84
-
85
-
86
-
87
-
88
-
89
-
90
-
91
-
92
-
93
-
94
-
95
-
96
-
97
-
98
-
99
-
100
-
101
-
102
-
103
-
104
-
105
-
106
-
107
-
108
-
109
-
110
-
111
-
112
-
113
-
114
-
115
-
116
-
117
-
118
-
119
-
120
-
121
-
122
-
123
-
124
-
125
-
126
-
127
-
128
-
129
-
130
-
131
-
132
-
133
-
134
-
135
-
136
-
137
-
138
-
139
-
140
-
141
-
142
-
143
-
144
-
145
-
146
-
147
-
148
-
149
-
150
-
151
-
152
-
153
-
154
-
155
-
156
-
157
-
158
-
159
-
160
-
161
-
162
-
163
-
164
-
165
-
166
-
167
-
168
-
169
-
170
-
171
-
172
-
173
-
174
-
175
-
176
-
177
-
178
-
179
-
180
-
181
-
182
-
183
-
184
-
185
-
186
-
187
-
188
-
189
-
190
-
191
-
192
-
193
-
194
-
195
-
196
-
197
-
198
-
199
-
200
-
201
-
202
-
203
-
204
-
205
-
206
-
207
-
208
-
209
-
210
-
211
-
212
-
213
-
214
-
215
-
216
-
217
-
218
-
219
-
220
-
221
-
222
-
223
-
224
-
225
 |
 |

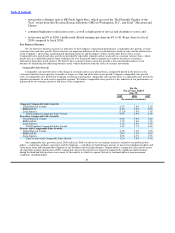
Table of Contents
As of June 30,
2009 2008
(In millions)
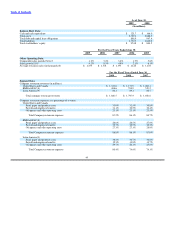
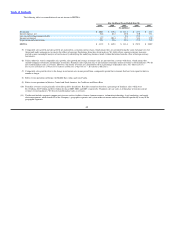
Balance Sheet Data:
Cash and cash equivalents $ 121.7 $ 166.0
Total assets 2,707.1 2,686.5
Total debt and capital lease obligations 888.9 947.4
Total liabilities 1,732.3 1,842.0
Total stockholders’ equity $ 974.8 $ 844.5
For the Fiscal Years Ended June 30,
2009 2008 2007 2006 2005
Other Operating Data:
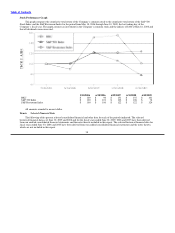
Comparable sales growth(5)(6)(7) 1.2% 5.4% 3.4% 1.9% 5.6%
Sales growth(5)(6) 4.2% 8.3% 4.9% 2.1% 6.1%
Average restaurant sales (in thousands)(6) $ 1,259 $ 1,301 $ 1,193 $ 1,126 $ 1,104
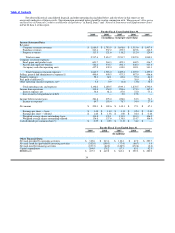
For the Fiscal Years Ended June 30,
2009 2008 2007
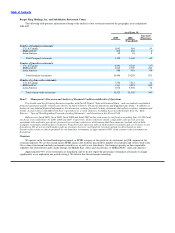
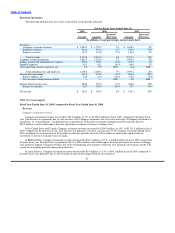
Segment Data:
Company restaurant revenues (in millions):
United States and Canada $ 1,331.8 $ 1,171.9 $ 1,082.1
EMEA/APAC(8) 488.6 554.9 515.2
Latin America(9) 60.1 69.1 60.7
Total company restaurant revenues $ 1,880.5 $ 1,795.9 $ 1,658.0
Company restaurant expenses as a percentage of revenue:
United States and Canada
Food, paper and products costs 33.0% 32.5% 30.8%
Payroll and employee benefits 31.1% 30.5% 30.4%
Occupancy and other operating costs 23.1% 23.1% 23.5%
Total Company restaurant expenses 87.2% 86.1% 84.7%
EMEA/APAC(8)
Food, paper and products costs 28.8% 28.5% 27.9%
Payroll and employee benefits 32.7% 30.5% 30.3%
Occupancy and other operating costs 27.3% 27.1% 28.8%
Total Company restaurant expenses 88.8% 86.1% 87.0%
Latin America(9)
Food, paper and products costs 38.4% 36.7% 36.6%
Payroll and employee benefits 12.3% 11.8% 11.7%
Occupancy and other operating costs 29.7% 26.1% 25.8%
Total Company restaurant expenses 80.4% 74.6% 74.1%
40