Burger King 2009 Annual Report Download - page 77
Download and view the complete annual report
Please find page 77 of the 2009 Burger King annual report below. You can navigate through the pages in the report by either clicking on the pages listed below, or by using the keyword search tool below to find specific information within the annual report.-
 1
1 -
2
-
3
-
4
-
5
-
6
-
7
-
8
-
9
-
10
-
11
-
12
-
13
-
14
-
15
-
16
-
17
-
18
-
19
-
20
-
21
-
22
-
23
-
24
-
25
-
26
-
27
-
28
-
29
-
30
-
31
-
32
-
33
-
34
-
35
-
36
-
37
-
38
-
39
-
40
-
41
-
42
-
43
-
44
-
45
-
46
-
47
-
48
-
49
-
50
-
51
-
52
-
53
-
54
-
55
-
56
-
57
-
58
-
59
-
60
-
61
-
62
-
63
-
64
-
65
-
66
-
 67
67 -
 68
68 -
 69
69 -
 70
70 -
 71
71 -
 72
72 -
 73
73 -
 74
74 -
 75
75 -
 76
76 -
 77
77 -
 78
78 -
 79
79 -
 80
80 -
 81
81 -
 82
82 -
 83
83 -
 84
84 -
 85
85 -
 86
86 -
 87
87 -
88
-
89
-
90
-
91
-
92
-
93
-
94
-
95
-
96
-
97
-
98
-
99
-
100
-
101
-
102
-
103
-
104
-
105
-
106
-
107
-
108
-
109
-
110
-
111
-
112
-
113
-
114
-
115
-
116
-
117
-
118
-
119
-
120
-
121
-
122
-
123
-
124
-
125
-
126
-
127
-
128
-
129
-
130
-
131
-
132
-
133
-
134
-
135
-
136
-
137
-
138
-
139
-
140
-
141
-
142
-
143
-
144
-
145
-
146
-
147
-
148
-
149
-
150
-
151
-
152
-
153
-
154
-
155
-
156
-
157
-
158
-
159
-
160
-
161
-
162
-
163
-
164
-
165
-
166
-
167
-
168
-
169
-
170
-
171
-
172
-
173
-
174
-
175
-
176
-
177
-
178
-
179
-
180
-
181
-
182
-
183
-
184
-
185
-
186
-
187
-
188
-
189
-
190
-
191
-
192
-
193
-
194
-
195
-
196
-
197
-
198
-
199
-
200
-
201
-
202
-
203
-
204
-
205
-
206
-
207
-
208
-
209
-
210
-
211
-
212
-
213
-
214
-
215
-
216
-
217
-
218
-
219
-
220
-
221
-
222
-
223
-
224
-
225
 |
 |

Table of Contents
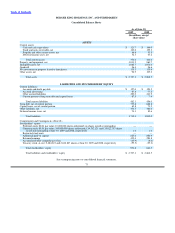
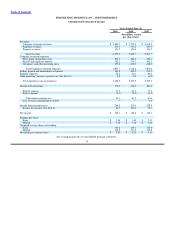
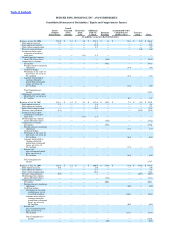
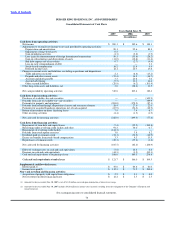
BURGER KING HOLDINGS, INC. AND SUBSIDIARIES
Consolidated Statements of Stockholders’ Equity and Comprehensive Income
Issued
Issued Common Restricted Additional Accumulated Other
Common Stock Stock Paid−In Retained Comprehensive Treasury
Stock Shares Amount Units Capital Earnings Income (Loss) Stock Total
(In millions, except per share information)
Balances at June 30, 2006 133.0 $ 1.4 $ 4.6 $ 545.2 $ 3.2 $ 14.6 $ (2.2) $ 566.8
Stock option exercises 2.2 — — 8.2 — — — 8.2
Stock option tax benefits — — — 13.5 — — — 13.5
Stock−based compensation — — — 4.9 — — — 4.9
Treasury stock purchases — — — — — — (1.6) (1.6)
Issuance of shares upon
settlement of restricted
stock units — — (1.8) 1.8 — — — —
Dividend paid on common
shares ($0.13 per share) — — — — (16.9) — — (16.9)
Comprehensive income:
Net income — — — — 148.1 — — 148.1
Foreign currency translation
adjustment — — — — — (5.4) — (5.4)
Cash flow hedges:
Net change in fair value of
derivatives, net of tax of
$3.4 million — — — — — (5.4) — (5.4)
Amounts reclassified to
earnings during the
period from terminated
swaps, net of tax of
$1.5 million — — — — — (2.5) — (2.5)
Total Comprehensive
income 134.8
Adjustment to initially apply
SFAS No 158, net of tax of
$3.7 million — — — — — 6.2 — 6.2
Balances at June 30, 2007 135.2 $ 1.4 $ 2.8 $ 573.6 $ 134.4 $ 7.5 $ (3.8) $ 715.9
Stock option exercises 1.2 — — 3.8 — — — 3.8
Stock option tax benefits — — — 9.3 — — — 9.3
Stock−based compensation — — — 11.4 — — — 11.4
Treasury stock purchases (1.4) — — — — — (35.4) (35.4)
Issuance of shares upon
settlement of restricted
stock units — — (2.8) 2.8 — — — —
Dividend paid on common
shares ($0.25 per share) — — — — (34.2) — — (34.2)
Comprehensive income:
Net income — — — — 189.6 — — 189.6
Foreign currency translation
adjustment — — — — — (1.7) — (1.7)
Cash flow hedges:
Net change in fair value of
derivatives, net of tax of
$3.9 million — — — — — (6.4) — (6.4)
Amounts reclassified to
earnings during the
period from terminated
swaps, net of tax of
$1.1 million — — — — — (1.3) — (1.3)
Pension and
post−retirement benefit
plans, net of tax of
$4.5 million — — — — — (6.5) — (6.5)
Total Comprehensive
income 173.7
Balances at June 30, 2008 135.0 $ 1.4 $ — $ 600.9 $ 289.8 $ (8.4) $ (39.2) $ 844.5
Stock option exercises 0.6 — — 3.0 — — — 3.0
Stock option tax benefits — — — 3.3 — — — 3.3
Stock−based compensation — — — 16.2 — — — 16.2
Treasury stock purchases (0.8) — — — — — (20.3) (20.3)
Dividend paid on common
shares ($0.25 per share) — — — — (34.1) — — (34.1)
Comprehensive income:
Net income — — — — 200.1 — — 200.1
Foreign currency translation
adjustment — — — — — (6.0) — (6.0)
Cash flow hedges:
Net change in fair value
of derivatives, net of
tax of $10.6 million — — — — — (16.8) — (16.8)
Amounts reclassified to
earnings during the
period from terminated
swaps, net of tax of
$0.4 million — — — — — (0.9) — (0.9)
Pension and
post−retirement benefit
plans, net of tax of
$9.2 million — — — — — (13.8) — (13.8)
Total Comprehensive
income — — — — — — — 162.6
— — — — (0.4) — — (0.4)