Burger King 2009 Annual Report Download - page 53
Download and view the complete annual report
Please find page 53 of the 2009 Burger King annual report below. You can navigate through the pages in the report by either clicking on the pages listed below, or by using the keyword search tool below to find specific information within the annual report.-
 1
1 -
2
-
3
-
4
-
5
-
6
-
7
-
8
-
9
-
10
-
11
-
12
-
13
-
14
-
15
-
16
-
17
-
18
-
19
-
20
-
21
-
22
-
23
-
24
-
25
-
26
-
27
-
28
-
29
-
30
-
31
-
32
-
33
-
34
-
35
-
36
-
37
-
38
-
39
-
40
-
41
-
42
-
 43
43 -
 44
44 -
 45
45 -
 46
46 -
 47
47 -
 48
48 -
 49
49 -
 50
50 -
 51
51 -
 52
52 -
 53
53 -
 54
54 -
 55
55 -
 56
56 -
 57
57 -
 58
58 -
 59
59 -
 60
60 -
 61
61 -
 62
62 -
 63
63 -
64
-
65
-
66
-
67
-
68
-
69
-
70
-
71
-
72
-
73
-
74
-
75
-
76
-
77
-
78
-
79
-
80
-
81
-
82
-
83
-
84
-
85
-
86
-
87
-
88
-
89
-
90
-
91
-
92
-
93
-
94
-
95
-
96
-
97
-
98
-
99
-
100
-
101
-
102
-
103
-
104
-
105
-
106
-
107
-
108
-
109
-
110
-
111
-
112
-
113
-
114
-
115
-
116
-
117
-
118
-
119
-
120
-
121
-
122
-
123
-
124
-
125
-
126
-
127
-
128
-
129
-
130
-
131
-
132
-
133
-
134
-
135
-
136
-
137
-
138
-
139
-
140
-
141
-
142
-
143
-
144
-
145
-
146
-
147
-
148
-
149
-
150
-
151
-
152
-
153
-
154
-
155
-
156
-
157
-
158
-
159
-
160
-
161
-
162
-
163
-
164
-
165
-
166
-
167
-
168
-
169
-
170
-
171
-
172
-
173
-
174
-
175
-
176
-
177
-
178
-
179
-
180
-
181
-
182
-
183
-
184
-
185
-
186
-
187
-
188
-
189
-
190
-
191
-
192
-
193
-
194
-
195
-
196
-
197
-
198
-
199
-
200
-
201
-
202
-
203
-
204
-
205
-
206
-
207
-
208
-
209
-
210
-
211
-
212
-
213
-
214
-
215
-
216
-
217
-
218
-
219
-
220
-
221
-
222
-
223
-
224
-
225
 |
 |

Table of Contents
currency exchange rates and negative Company comparable sales growth of 3.2% (in constant currencies). However, this decrease was
largely offset by a net increase of eight Company restaurants during fiscal 2009.
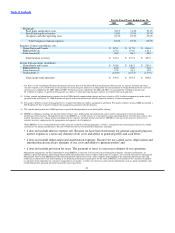
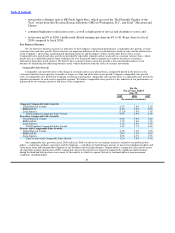
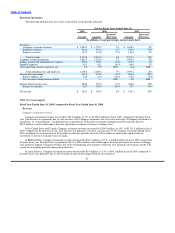
Franchise revenues
Total franchise revenues increased by $6.2 million, or 1%, to $543.4 million in fiscal 2009, compared to the prior fiscal year,
primarily due to the net increase of 291 franchise restaurants during fiscal 2009, worldwide franchise comparable sales growth of 1.4%
(in constant currencies) and a higher effective royalty rate in the U.S. These factors were partially offset by a $24.2 million unfavorable
impact from the movement of currency exchange rates.
In the United States and Canada, franchise revenues increased by $5.2 million, or 2%, to $323.1 million in fiscal 2009, compared
to the prior fiscal year. This increase was the result of a higher effective royalty rate in the U.S., partially offset by the loss of royalties
from 37 fewer franchise restaurants compared to the same period in the prior year, primarily due to the net acquisition of 42 franchise
restaurants by the Company, and a $1.0 million unfavorable impact from the movement of currency exchange rates in Canada.
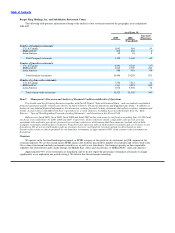
In EMEA/APAC, franchise revenues increased by $0.4 million, or 0.2%, to $173.4 million in fiscal 2009, compared the prior
fiscal year. This increase was primarily driven by a net increase of 260 franchise restaurants during fiscal 2009 and franchise
comparable sales growth of 3.3% (in constant currencies). These factors were largely offset by a $20.4 million unfavorable impact from
the movement of currency exchange rates.
Latin America franchise revenues increased by $0.6 million, or 1%, to $46.9 million in fiscal 2009, compared to the prior fiscal
year. This increase was primarily a result of the net addition of 68 franchise restaurants during fiscal 2009 and franchise comparable
sales growth of 2.3% (in constant currencies). However, these factors were largely offset by a $2.8 million unfavorable impact from the
movement of currency exchange rates.
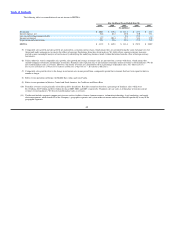
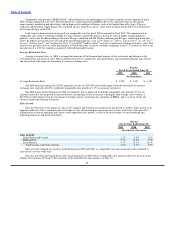
Property Revenues
Total property revenues decreased by $8.1 million, or 7%, to $113.5 million for fiscal 2009, compared to the prior fiscal year,
primarily due to a $5.9 million unfavorable impact from the movement of currency exchange rates and the reduction in the number of
properties in our portfolio, which includes the impact of the closure or acquisition of restaurants leased to franchisees. These factors
were partially offset by positive worldwide franchise comparable sales growth, which resulted in increased revenues from percentage
rents.
In the United States and Canada, property revenues decreased by $0.6 million, or 1%, to $88.1 million for fiscal 2009, compared
to the prior fiscal year, primarily as a result of the reduction in the number of properties in our portfolio and a $0.7 million unfavorable
impact from the movement of currency exchange rates. This decrease was partially offset by increased revenues from percentage rents
as a result of positive franchise comparable sales growth.
In EMEA/APAC, property revenues decreased by $7.5 million, or 23%, to $25.4 million for fiscal 2009, compared to the prior
year, primarily due to a $5.2 million unfavorable impact from the movement of currency exchange rates and the reduction in the
number of properties in our portfolio. These factors were partially offset by increased revenues from percentage rents as a result of
positive franchise comparable sales growth.
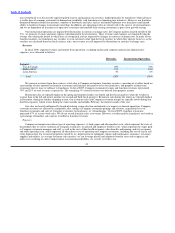
Operating Costs and Expenses
Food, paper and product costs
Total food, paper and product costs increased by $39.4 million, or 7%, to $603.7 million in fiscal 2009, primarily as a result of the
net addition of 69 Company restaurants during the twelve months ended June 30, 2009, and significant increases in commodity costs,
including the negative currency exchange impact of cross border purchases which occurs in Canada, Mexico and the U.K. when our
suppliers purchase goods in currency other than the local currency in which they operate and pass on all, or a portion of the currency
exchange impact to us. These factors were partially offset by a $26.1 million favorable impact from the movement of currency
exchange rates. As
51