Burger King 2009 Annual Report Download - page 114
Download and view the complete annual report
Please find page 114 of the 2009 Burger King annual report below. You can navigate through the pages in the report by either clicking on the pages listed below, or by using the keyword search tool below to find specific information within the annual report.-
 1
1 -
2
-
3
-
4
-
5
-
6
-
7
-
8
-
9
-
10
-
11
-
12
-
13
-
14
-
15
-
16
-
17
-
18
-
19
-
20
-
21
-
22
-
23
-
24
-
25
-
26
-
27
-
28
-
29
-
30
-
31
-
32
-
33
-
34
-
35
-
36
-
37
-
38
-
39
-
40
-
41
-
42
-
43
-
44
-
45
-
46
-
47
-
48
-
49
-
50
-
51
-
52
-
53
-
54
-
55
-
56
-
57
-
58
-
59
-
60
-
61
-
62
-
63
-
64
-
65
-
66
-
67
-
68
-
69
-
70
-
71
-
72
-
73
-
74
-
75
-
76
-
77
-
78
-
79
-
80
-
81
-
82
-
83
-
84
-
85
-
86
-
87
-
88
-
89
-
90
-
91
-
92
-
93
-
94
-
95
-
96
-
97
-
98
-
99
-
100
-
101
-
102
-
103
-
 104
104 -
 105
105 -
 106
106 -
 107
107 -
 108
108 -
 109
109 -
 110
110 -
 111
111 -
 112
112 -
 113
113 -
 114
114 -
 115
115 -
 116
116 -
 117
117 -
 118
118 -
 119
119 -
 120
120 -
 121
121 -
 122
122 -
 123
123 -
 124
124 -
125
-
126
-
127
-
128
-
129
-
130
-
131
-
132
-
133
-
134
-
135
-
136
-
137
-
138
-
139
-
140
-
141
-
142
-
143
-
144
-
145
-
146
-
147
-
148
-
149
-
150
-
151
-
152
-
153
-
154
-
155
-
156
-
157
-
158
-
159
-
160
-
161
-
162
-
163
-
164
-
165
-
166
-
167
-
168
-
169
-
170
-
171
-
172
-
173
-
174
-
175
-
176
-
177
-
178
-
179
-
180
-
181
-
182
-
183
-
184
-
185
-
186
-
187
-
188
-
189
-
190
-
191
-
192
-
193
-
194
-
195
-
196
-
197
-
198
-
199
-
200
-
201
-
202
-
203
-
204
-
205
-
206
-
207
-
208
-
209
-
210
-
211
-
212
-
213
-
214
-
215
-
216
-
217
-
218
-
219
-
220
-
221
-
222
-
223
-
224
-
225
 |
 |

Table of Contents
BURGER KING HOLDINGS, INC. AND SUBSIDIARIES
Notes to Consolidated Financial Statements — (Continued)
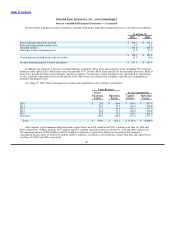
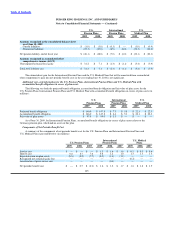
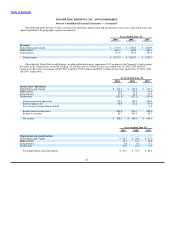
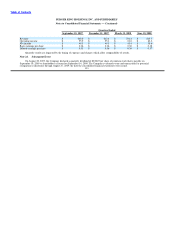
The following tables present revenues, income from operations, depreciation and amortization, total assets, long−lived assets and
capital expenditures by geographic segment (in millions):
Years Ended June 30,
2009 2008 2007
Revenues:
United States and Canada $ 1,743.0 $ 1,578.5 $ 1,450.9
EMEA/APAC 687.4 760.8 681.3
Latin America 107.0 115.4 101.5
Total revenues $ 2,537.4 $ 2,454.7 $ 2,233.7
Other than the United States and Germany, no other individual country represented 10% or more of the Company’s total revenues.
Revenues in the United States totaled $1.6 billion, $1.4 billion and $1.3 billion for the years ended June 30, 2009, 2008 and 2007,
respectively. Revenues in Germany totaled $307.2 million, $349.5 million and $308.1 million for the years ended June 30, 2009, 2008
and 2007, respectively.
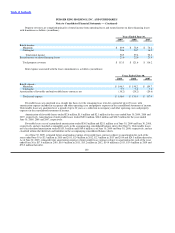
Years Ended June 30,
2009 2008 2007
Income from Operations:
United States and Canada $ 341.8 $ 348.2 $ 339.4
EMEA/APAC 83.6 91.8 53.9
Latin America 37.8 41.4 35.2
Unallocated (123.8) (127.2) (133.9)
Total income from operations 339.4 354.2 294.6
Interest expense, net 54.6 61.2 67.0
Loss on early extinguishment of debt — — 0.8
Income before income taxes 284.8 293.0 226.8
Income tax expense 84.7 103.4 78.7
Net income $ 200.1 $ 189.6 $ 148.1
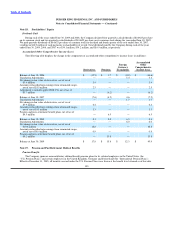
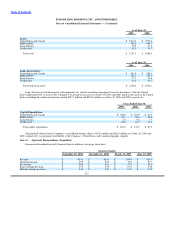
Years Ended June 30,
2009 2008 2007
Depreciation and Amortization:
United States and Canada $ 63.4 $ 64.0 $ 61.0
EMEA/APAC 15.7 14.1 12.5
Latin America 5.6 4.5 4.2
Unallocated 13.4 13.0 11.1
Total depreciation and amortization $ 98.1 $ 95.6 $ 88.8
111