BMW 2010 Annual Report Download - page 99
Download and view the complete annual report
Please find page 99 of the 2010 BMW annual report below. You can navigate through the pages in the report by either clicking on the pages listed below, or by using the keyword search tool below to find specific information within the annual report.-
 1
1 -
2
-
3
-
4
-
5
-
6
-
7
-
8
-
9
-
10
-
11
-
12
-
13
-
14
-
15
-
16
-
17
-
18
-
19
-
20
-
21
-
22
-
23
-
24
-
25
-
26
-
27
-
28
-
29
-
30
-
31
-
32
-
33
-
34
-
35
-
36
-
37
-
38
-
39
-
40
-
41
-
42
-
43
-
44
-
45
-
46
-
47
-
48
-
49
-
50
-
51
-
52
-
53
-
54
-
55
-
56
-
57
-
58
-
59
-
60
-
61
-
62
-
63
-
64
-
65
-
66
-
67
-
68
-
69
-
70
-
71
-
72
-
73
-
74
-
75
-
76
-
77
-
78
-
79
-
80
-
81
-
82
-
83
-
84
-
85
-
86
-
87
-
88
-
 89
89 -
 90
90 -
 91
91 -
 92
92 -
 93
93 -
 94
94 -
 95
95 -
 96
96 -
 97
97 -
 98
98 -
 99
99 -
 100
100 -
 101
101 -
 102
102 -
 103
103 -
 104
104 -
 105
105 -
 106
106 -
 107
107 -
 108
108 -
 109
109 -
110
-
111
-
112
-
113
-
114
-
115
-
116
-
117
-
118
-
119
-
120
-
121
-
122
-
123
-
124
-
125
-
126
-
127
-
128
-
129
-
130
-
131
-
132
-
133
-
134
-
135
-
136
-
137
-
138
-
139
-
140
-
141
-
142
-
143
-
144
-
145
-
146
-
147
-
148
-
149
-
150
-
151
-
152
-
153
-
154
-
155
-
156
-
157
-
158
-
159
-
160
-
161
-
162
-
163
-
164
-
165
-
166
-
167
-
168
-
169
-
170
-
171
-
172
-
173
-
174
-
175
-
176
-
177
-
178
-
179
-
180
-
181
-
182
-
183
-
184
-
185
-
186
-
187
-
188
-
189
-
190
-
191
-
192
-
193
-
194
-
195
-
196
-
197
-
198
-
199
-
200
-
201
-
202
-
203
-
204
-
205
-
206
-
207
-
208
-
209
-
210
-
211
-
212
-
213
-
214
-
215
-
216
-
217
-
218
-
219
-
220
-
221
-
222
-
223
-
224
-
225
-
226
-
227
-
228
-
229
-
230
-
231
-
232
-
233
-
234
-
235
-
236
-
237
-
238
-
239
-
240
-
241
-
242
-
243
-
244
-
245
-
246
-
247
-
248
-
249
-
250
-
251
-
252
-
253
-
254
-
255
-
256
-
257
-
258
-
259
-
260
-
261
-
262
-
263
-
264
-
265
-
266
-
267
-
268
-
269
-
270
-
271
-
272
-
273
-
274
-
275
-
276
-
277
-
278
-
279
-
280
-
281
-
282
 |
 |

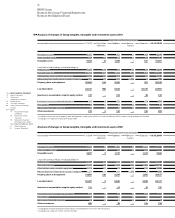
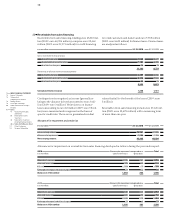
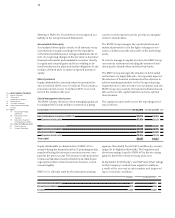
97 GROUP FINANCIAL STATEMENTS
Depreciation and amortisation Carrying amount
1. 1. 20101 Translation Current year Disposals Reversal 31. 12. 2010 31. 12. 2010 31. 12. 2009
differences of impair-
ment losses
3,761 – 1,260 499 – 4,522 4,625 4,934 Development costs
414 7 119 36 – 504 406 445 Other intangible assets
4,175 7 1,379 535 – 5,026 5,031 5,379 Intangible assets
Land, titles to land, buildings, including buildings on
2,936 47 226 23 – 3,186 4,385 4,404 third party land
16,732 165 1,933 595 – 18,235 5,931 5,983 Plant and machinery
1,623 43 144 80 – 1,730 412 433 Other facilities, factory and office equipment
1 – – – – 1 6992 565 Advance payments made and construction in progress
21,292 255 2,303 698 – 23,152 11,427 11,385 Property, plant and equipment
6,444 259 2,817 3,354 – 6,166 17,791 17,973 Leased products
– – – – – – 212 137
Investments accounted for using the equity method
82 1 179 177 3 82 169 225 Investments in non-consolidated subsidiaries
5 –1 – – – 4 8 3 Participations
– – – – – – – 4 Non-current marketable securities
87 – 179 177 3 86 177 232 Other investments
Depreciation and amortisation Carrying amount
1. 1. 20091 Translation Current year Disposals Reversal 31. 12. 2009 31. 12. 2009 31. 12. 2008
differences of impair-
ment losses
3,782 – 1,226 1,247 – 3,761 4,934 5,073 Development costs
401 – 114 101 – 414 445 568 Other intangible assets
4,183 – 1,340 1,348 – 4,175 5,379 5,641 Intangible assets
Land, titles to land, buildings, including buildings on
2,745 19 213 41 – 2,936 4,404 4,157 third party land
16,150 58 1,885 1,361 – 16,732 5,983 5,518 Plant and machinery
1,574 10 162 123 – 1,623 433 497 Other facilities, factory and office equipment
1 – – – – 1 5652 1,120 Advance payments made and construction in progress
20,470 87 2,260 1,525 – 21,292 11,385 11,292 Property, plant and equipment
5,883 – 5 3,689 3,123 – 6,444 17,973 19,524 Leased products
– – – – – – 137 111
Investments accounted for using the equity method
79 – 3 – – 82 225 296 Investments in non-consolidated subsidiaries
5 – – – – 5 3 3 Participations
– – – – – – 4 23 Non-current marketable securities
84 – 3 – – 87 232 322 Other investments