BMW 2010 Annual Report Download - page 17
Download and view the complete annual report
Please find page 17 of the 2010 BMW annual report below. You can navigate through the pages in the report by either clicking on the pages listed below, or by using the keyword search tool below to find specific information within the annual report.-
 1
1 -
2
-
3
-
4
-
5
-
6
-
 7
7 -
 8
8 -
 9
9 -
 10
10 -
 11
11 -
 12
12 -
 13
13 -
 14
14 -
 15
15 -
 16
16 -
 17
17 -
 18
18 -
 19
19 -
 20
20 -
 21
21 -
 22
22 -
 23
23 -
 24
24 -
 25
25 -
 26
26 -
 27
27 -
28
-
29
-
30
-
31
-
32
-
33
-
34
-
35
-
36
-
37
-
38
-
39
-
40
-
41
-
42
-
43
-
44
-
45
-
46
-
47
-
48
-
49
-
50
-
51
-
52
-
53
-
54
-
55
-
56
-
57
-
58
-
59
-
60
-
61
-
62
-
63
-
64
-
65
-
66
-
67
-
68
-
69
-
70
-
71
-
72
-
73
-
74
-
75
-
76
-
77
-
78
-
79
-
80
-
81
-
82
-
83
-
84
-
85
-
86
-
87
-
88
-
89
-
90
-
91
-
92
-
93
-
94
-
95
-
96
-
97
-
98
-
99
-
100
-
101
-
102
-
103
-
104
-
105
-
106
-
107
-
108
-
109
-
110
-
111
-
112
-
113
-
114
-
115
-
116
-
117
-
118
-
119
-
120
-
121
-
122
-
123
-
124
-
125
-
126
-
127
-
128
-
129
-
130
-
131
-
132
-
133
-
134
-
135
-
136
-
137
-
138
-
139
-
140
-
141
-
142
-
143
-
144
-
145
-
146
-
147
-
148
-
149
-
150
-
151
-
152
-
153
-
154
-
155
-
156
-
157
-
158
-
159
-
160
-
161
-
162
-
163
-
164
-
165
-
166
-
167
-
168
-
169
-
170
-
171
-
172
-
173
-
174
-
175
-
176
-
177
-
178
-
179
-
180
-
181
-
182
-
183
-
184
-
185
-
186
-
187
-
188
-
189
-
190
-
191
-
192
-
193
-
194
-
195
-
196
-
197
-
198
-
199
-
200
-
201
-
202
-
203
-
204
-
205
-
206
-
207
-
208
-
209
-
210
-
211
-
212
-
213
-
214
-
215
-
216
-
217
-
218
-
219
-
220
-
221
-
222
-
223
-
224
-
225
-
226
-
227
-
228
-
229
-
230
-
231
-
232
-
233
-
234
-
235
-
236
-
237
-
238
-
239
-
240
-
241
-
242
-
243
-
244
-
245
-
246
-
247
-
248
-
249
-
250
-
251
-
252
-
253
-
254
-
255
-
256
-
257
-
258
-
259
-
260
-
261
-
262
-
263
-
264
-
265
-
266
-
267
-
268
-
269
-
270
-
271
-
272
-
273
-
274
-
275
-
276
-
277
-
278
-
279
-
280
-
281
-
282
 |
 |

15 GROUP MANAGEMENT REPORT
the euro at the beginning of the year, partly as a result of
the zero interest policy pursued by the US Federal Reserve
Bank,
the US currency appreciated at one stage to US dol-
lar 1.19
during
the confidence crisis in the euro zone. At
the end of 2010
the exchange rate stood at US dollar 1.34,
thus making the US dollar 7.4% stronger than one year
earlier.
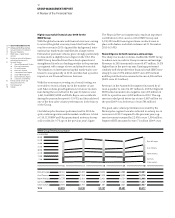
Due to the ongoing weakness of the British economy, the
British pound remained weak against the euro through-
out 2010, hovering at around British pound 0.85 to the
euro. The Japanese yen gained further ground against the
euro during 2010, ending the year at yen 109 to the euro.
Massive capital inflows meant that the currencies of
practically all emerging market countries gained in value
in 2010 after suffering losses during the financial crisis,
insome cases quite significant ones.
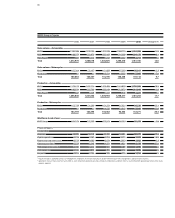
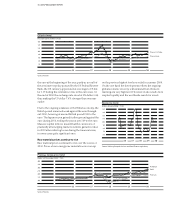
Raw materials prices continue to rise
Raw material prices continued to rise over the course of
2010. Prices of non-energy raw materials were even up
on the previous highest levels recorded in summer 2008.
On the one hand the development reflects
the ongoing
global economic recovery, with demand from
China re-
maining at a very high level. However, it also results from
surplus liquidity and the worldwide search for invest-
Steel price trend
(Index: January 2006 = 100)
140
130
120
110
100
90
80
70
60
06 07 08 09 10
Source: Working Group for the Iron and Metal Processing Industry
Oil price trend
Price per barrel of Brent Crude
160
140
120
100
80
60
40
20
06 07 08 09 10
Source: Reuters
Price in Euro
Price in US Dollar
Precious metals price trend
(Index: 30 December 2005 = 100)
400
350
300
250
200
150
100
06 07 08 09 10
Source: Reuters
Gold
Palladium
Platinum