BMW 2010 Annual Report Download - page 138
Download and view the complete annual report
Please find page 138 of the 2010 BMW annual report below. You can navigate through the pages in the report by either clicking on the pages listed below, or by using the keyword search tool below to find specific information within the annual report.-
 1
1 -
2
-
3
-
4
-
5
-
6
-
7
-
8
-
9
-
10
-
11
-
12
-
13
-
14
-
15
-
16
-
17
-
18
-
19
-
20
-
21
-
22
-
23
-
24
-
25
-
26
-
27
-
28
-
29
-
30
-
31
-
32
-
33
-
34
-
35
-
36
-
37
-
38
-
39
-
40
-
41
-
42
-
43
-
44
-
45
-
46
-
47
-
48
-
49
-
50
-
51
-
52
-
53
-
54
-
55
-
56
-
57
-
58
-
59
-
60
-
61
-
62
-
63
-
64
-
65
-
66
-
67
-
68
-
69
-
70
-
71
-
72
-
73
-
74
-
75
-
76
-
77
-
78
-
79
-
80
-
81
-
82
-
83
-
84
-
85
-
86
-
87
-
88
-
89
-
90
-
91
-
92
-
93
-
94
-
95
-
96
-
97
-
98
-
99
-
100
-
101
-
102
-
103
-
104
-
105
-
106
-
107
-
108
-
109
-
110
-
111
-
112
-
113
-
114
-
115
-
116
-
117
-
118
-
119
-
120
-
121
-
122
-
123
-
124
-
125
-
126
-
127
-
 128
128 -
 129
129 -
 130
130 -
 131
131 -
 132
132 -
 133
133 -
 134
134 -
 135
135 -
 136
136 -
 137
137 -
 138
138 -
 139
139 -
 140
140 -
 141
141 -
 142
142 -
 143
143 -
 144
144 -
 145
145 -
 146
146 -
 147
147 -
 148
148 -
149
-
150
-
151
-
152
-
153
-
154
-
155
-
156
-
157
-
158
-
159
-
160
-
161
-
162
-
163
-
164
-
165
-
166
-
167
-
168
-
169
-
170
-
171
-
172
-
173
-
174
-
175
-
176
-
177
-
178
-
179
-
180
-
181
-
182
-
183
-
184
-
185
-
186
-
187
-
188
-
189
-
190
-
191
-
192
-
193
-
194
-
195
-
196
-
197
-
198
-
199
-
200
-
201
-
202
-
203
-
204
-
205
-
206
-
207
-
208
-
209
-
210
-
211
-
212
-
213
-
214
-
215
-
216
-
217
-
218
-
219
-
220
-
221
-
222
-
223
-
224
-
225
-
226
-
227
-
228
-
229
-
230
-
231
-
232
-
233
-
234
-
235
-
236
-
237
-
238
-
239
-
240
-
241
-
242
-
243
-
244
-
245
-
246
-
247
-
248
-
249
-
250
-
251
-
252
-
253
-
254
-
255
-
256
-
257
-
258
-
259
-
260
-
261
-
262
-
263
-
264
-
265
-
266
-
267
-
268
-
269
-
270
-
271
-
272
-
273
-
274
-
275
-
276
-
277
-
278
-
279
-
280
-
281
-
282
 |
 |

136
74 GROUP FINANCIAL STATEMENTS
74 Income Statements
74 Statement of
Comprehensive Income
76 Balance Sheets
78 Cash Flow Statements
80 Group Statement of Changes
in Equity
81 Notes
81 Accounting Principles
and Policies
89 Notes to the Income
Statement
95 Notes to the Statement
of Comprehensive Income
96 Notes to the Balance Sheet
117 Other Disclosures
133 Segment Information
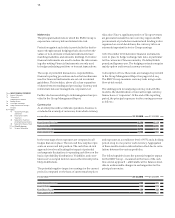
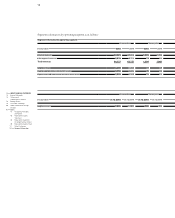
in euro million 2010 2009
Reconciliation of segment result
Total for reportable segments 5,685 170
Financial result of Automobiles segment and Motorcycles segment – 474 – 331
Elimination of inter-segment items – 375 574
Group profit before tax 4,836 413
Reconciliation of capital expenditure on non-current assets
Total for reportable segments 15,161 13,904
Elimination of inter-segment items – 2,564 –1,787
Total Group capital expenditure on non-current assets 12,597 12,117
Reconciliation of depreciation and amortisation on non-current assets
Total for reportable segments 8,511 9,339
Elimination of inter-segment items – 2,012 – 2,050
Total Group depreciation and amortisation on non-current assets 6,499 7,289
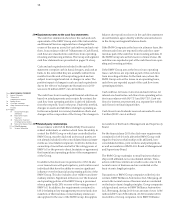
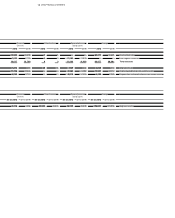
Reconciliation of segment assets
Total for reportable segments 60,268 56,944
Non-operating assets – Other Entities segment 5,414 5,797
Operating liabilities – Financial Services segment 68,487 67,008
Interest-bearing assets – Automobiles and Motorcycles segments 30,300 25,826
Liabilities of Automobiles and Motorcycles segments not subject to interest 18,971 15,541
Elimination of inter-segment items – 74,573 – 69,163
Total Group assets 108,867 101,953
Interest and similar income of the Financial Services seg-
ment totalling euro 4 million (2009: euro 3 million) are
included in segment result. Interest and similar expenses
of the Financial Services segment amounted to euro 7 mil-
lion
(2009: euro 8 million). The Other Entities segment
result includes interest and similar income amounting to
euro 1,984 million (2009: euro 1,778 million) and inter-
est and similar expenses amounting to euro 2,058 million
(2009: euro 1,852 million).
Also included in the Other Entities segment result is the
result from equity accounted investments amounting to
euro zero million in 2010 (2009: negative result of euro
6million).
Segment assets of the Other Entities segment at
31 De-
cember 2010 included investments accounted for
using
the equity method amounting to euro 23 million (2009:
euro 23 million).
The information disclosed for capital expenditure and
depreciation and amortisation relates to property,
plantand equipment, intangible assets and leased
products.
Segment figures can be reconciled to the corresponding
Group figures as follows: