BMW 2010 Annual Report Download - page 91
Download and view the complete annual report
Please find page 91 of the 2010 BMW annual report below. You can navigate through the pages in the report by either clicking on the pages listed below, or by using the keyword search tool below to find specific information within the annual report.-
 1
1 -
2
-
3
-
4
-
5
-
6
-
7
-
8
-
9
-
10
-
11
-
12
-
13
-
14
-
15
-
16
-
17
-
18
-
19
-
20
-
21
-
22
-
23
-
24
-
25
-
26
-
27
-
28
-
29
-
30
-
31
-
32
-
33
-
34
-
35
-
36
-
37
-
38
-
39
-
40
-
41
-
42
-
43
-
44
-
45
-
46
-
47
-
48
-
49
-
50
-
51
-
52
-
53
-
54
-
55
-
56
-
57
-
58
-
59
-
60
-
61
-
62
-
63
-
64
-
65
-
66
-
67
-
68
-
69
-
70
-
71
-
72
-
73
-
74
-
75
-
76
-
77
-
78
-
79
-
80
-
 81
81 -
 82
82 -
 83
83 -
 84
84 -
 85
85 -
 86
86 -
 87
87 -
 88
88 -
 89
89 -
 90
90 -
 91
91 -
 92
92 -
 93
93 -
 94
94 -
 95
95 -
 96
96 -
 97
97 -
 98
98 -
 99
99 -
 100
100 -
 101
101 -
102
-
103
-
104
-
105
-
106
-
107
-
108
-
109
-
110
-
111
-
112
-
113
-
114
-
115
-
116
-
117
-
118
-
119
-
120
-
121
-
122
-
123
-
124
-
125
-
126
-
127
-
128
-
129
-
130
-
131
-
132
-
133
-
134
-
135
-
136
-
137
-
138
-
139
-
140
-
141
-
142
-
143
-
144
-
145
-
146
-
147
-
148
-
149
-
150
-
151
-
152
-
153
-
154
-
155
-
156
-
157
-
158
-
159
-
160
-
161
-
162
-
163
-
164
-
165
-
166
-
167
-
168
-
169
-
170
-
171
-
172
-
173
-
174
-
175
-
176
-
177
-
178
-
179
-
180
-
181
-
182
-
183
-
184
-
185
-
186
-
187
-
188
-
189
-
190
-
191
-
192
-
193
-
194
-
195
-
196
-
197
-
198
-
199
-
200
-
201
-
202
-
203
-
204
-
205
-
206
-
207
-
208
-
209
-
210
-
211
-
212
-
213
-
214
-
215
-
216
-
217
-
218
-
219
-
220
-
221
-
222
-
223
-
224
-
225
-
226
-
227
-
228
-
229
-
230
-
231
-
232
-
233
-
234
-
235
-
236
-
237
-
238
-
239
-
240
-
241
-
242
-
243
-
244
-
245
-
246
-
247
-
248
-
249
-
250
-
251
-
252
-
253
-
254
-
255
-
256
-
257
-
258
-
259
-
260
-
261
-
262
-
263
-
264
-
265
-
266
-
267
-
268
-
269
-
270
-
271
-
272
-
273
-
274
-
275
-
276
-
277
-
278
-
279
-
280
-
281
-
282
 |
 |

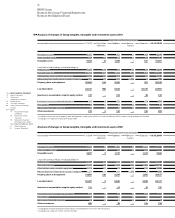
89 GROUP FINANCIAL STATEMENTS
in euro million 2010 2009
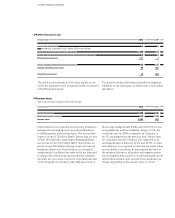
Sales of products and related goods 44,838 36,126
Income from lease instalments 5,181 5,641
Sale of products previously leased to customers 6,139 5,294
Interest income on loan financing 2,604 2,582
Other income 1,715 1,038
Revenues 60,477 50,681
in euro million 2010 2009
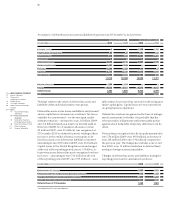
Manufacturing costs 29,173 24,930
Research and development costs 3,082 2,587
Warranty expenditure 928 996
Cost of sales directly attributable to financial services 11,110 10,092
Interest expense relating to financial services business 2,112 2,879
Expense for risk provisions and write-downs for financial services business 893 1,310
Other cost of sales 2,264 2,562
Cost of sales 49,562 45,356
in euro million 2010 2009
Research and development costs 3,082 2,587
Amortisation –1,260 –1,226
New expenditure for capitalised development costs 951 1,087
Total research and development expenditure 2,773 2,448
BMW Group
Notes to the Group Financial Statements
Notes to the Income Statement
7
8
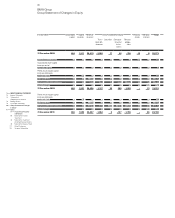
Revenues
Revenues by activity comprise the following:
An analysis of revenues by business segment and geographical region is shown in the segment information on
pages 133 et seq.
9
Cost of sales
Cost of sales comprises:
Cost of sales include euro 14,115 million (2009: euro
14,281 million) relating to financial services business.
As in the previous year, manufacturing costs do not
con-
tain any impairment losses on intangible assets and
property, plant and equipment. Cost of sales is reduced
by public-sector subsidies in the form of reduced taxes
Sales and administrative costs
Sales costs amounted to euro 4,020 million (2009: euro
3,647 million) and comprise mainly marketing, advertis-
ing and sales personnel costs.
on assets and reduced consumption-based taxes
amounting to euro 36 million (2009: euro 27 million).
Total research and development expenditure compris-
ing
research costs, development costs not recognised
asassets and capitalised development costs were as
follows:
Administrative costs amounted to euro 1,509 million
(2009: euro 1,393 million) and comprise expenses for
administration not attributable to development, produc-
tion or sales functions.