BMW 2010 Annual Report Download - page 52
Download and view the complete annual report
Please find page 52 of the 2010 BMW annual report below. You can navigate through the pages in the report by either clicking on the pages listed below, or by using the keyword search tool below to find specific information within the annual report.-
 1
1 -
2
-
3
-
4
-
5
-
6
-
7
-
8
-
9
-
10
-
11
-
12
-
13
-
14
-
15
-
16
-
17
-
18
-
19
-
20
-
21
-
22
-
23
-
24
-
25
-
26
-
27
-
28
-
29
-
30
-
31
-
32
-
33
-
34
-
35
-
36
-
37
-
38
-
39
-
40
-
41
-
 42
42 -
 43
43 -
 44
44 -
 45
45 -
 46
46 -
 47
47 -
 48
48 -
 49
49 -
 50
50 -
 51
51 -
 52
52 -
 53
53 -
 54
54 -
 55
55 -
 56
56 -
 57
57 -
 58
58 -
 59
59 -
 60
60 -
 61
61 -
 62
62 -
63
-
64
-
65
-
66
-
67
-
68
-
69
-
70
-
71
-
72
-
73
-
74
-
75
-
76
-
77
-
78
-
79
-
80
-
81
-
82
-
83
-
84
-
85
-
86
-
87
-
88
-
89
-
90
-
91
-
92
-
93
-
94
-
95
-
96
-
97
-
98
-
99
-
100
-
101
-
102
-
103
-
104
-
105
-
106
-
107
-
108
-
109
-
110
-
111
-
112
-
113
-
114
-
115
-
116
-
117
-
118
-
119
-
120
-
121
-
122
-
123
-
124
-
125
-
126
-
127
-
128
-
129
-
130
-
131
-
132
-
133
-
134
-
135
-
136
-
137
-
138
-
139
-
140
-
141
-
142
-
143
-
144
-
145
-
146
-
147
-
148
-
149
-
150
-
151
-
152
-
153
-
154
-
155
-
156
-
157
-
158
-
159
-
160
-
161
-
162
-
163
-
164
-
165
-
166
-
167
-
168
-
169
-
170
-
171
-
172
-
173
-
174
-
175
-
176
-
177
-
178
-
179
-
180
-
181
-
182
-
183
-
184
-
185
-
186
-
187
-
188
-
189
-
190
-
191
-
192
-
193
-
194
-
195
-
196
-
197
-
198
-
199
-
200
-
201
-
202
-
203
-
204
-
205
-
206
-
207
-
208
-
209
-
210
-
211
-
212
-
213
-
214
-
215
-
216
-
217
-
218
-
219
-
220
-
221
-
222
-
223
-
224
-
225
-
226
-
227
-
228
-
229
-
230
-
231
-
232
-
233
-
234
-
235
-
236
-
237
-
238
-
239
-
240
-
241
-
242
-
243
-
244
-
245
-
246
-
247
-
248
-
249
-
250
-
251
-
252
-
253
-
254
-
255
-
256
-
257
-
258
-
259
-
260
-
261
-
262
-
263
-
264
-
265
-
266
-
267
-
268
-
269
-
270
-
271
-
272
-
273
-
274
-
275
-
276
-
277
-
278
-
279
-
280
-
281
-
282
 |
 |

50
12 GROUP MANAGEMENT REPORT
12 A Review of the Financial Year
14 General Economic Environment
18 Review of Operations
41 BMW Group – Capital Market
Activities
44 Disclosures relevant for takeovers
and explanatory comments
47 Financial Analysis
47 Internal Management System
49 Earnings Performance
51 Financial Position
53 Net Assets Position
55 Subsequent Events Report
55 Value Added Statement
57 Key Performance Figures
58 Comments on BMW AG
62 Internal Control System and
explanatory comments
63 Risk Management
70 Outlook
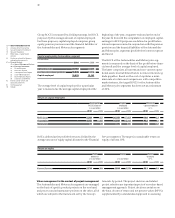
cycles business revenues were 21.9% up on the previous
year. Revenues generated with Financial Services activities
rose by 6.8%. Revenues attributable to “Other Entities”
amounted to euro 1 million, similar to the previous year.
Total revenues grew in the Africa, Asia and Oceania
regions by 68.2%. The figure includes China, where rev-
enues jumped by 109.1%. Revenues in Europe and the
Americas region grew by 9.4% and 14.0% respectively,
whereas they fell in Germany by 2.0%.
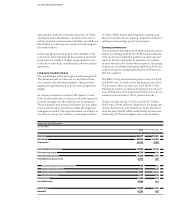
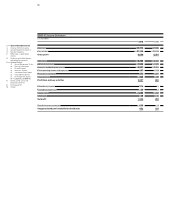
Group cost of sales increased by 9.3% to euro 49,562 mil-
lion
(2009: euro 45,356 million), rising therefore at a
slower rate than revenues. The main factors responsible
for the improvement were reduced material costs and
lower refinancing costs. As a result, the gross profit jumped
by 105.0% to euro 10,915 million. The gross profit mar-
gin was 18.0% (2009: 10.5%).
The gross profit margin recorded by the Automobiles
segment was 17.4% (2009: 9.4%) and that of the
Motor-
cycles segment was 16.0% (2009: 13.5%). The Finan-
cial
Services segment’s gross profit margin improved by
5.1 percentage points to 10.9%.
Research and development costs rose by 19.1% to euro
3,082 million and represented 5.1% of revenues, un-
changed compared to the previous year. Research and
development costs include amortisation of capitalised
development costs amounting to euro 1,260 million (2009:
e
uro 1,226 million). Total research and development
expenditures amounted to euro 2,773 million (2009:
euro 2,448 million). This figure comprises research costs,
development costs not recognised as assets and capital-
ised development costs. The research and development
expenditure ratio for 2010 was 4.6% (2009: 4.8%). The
proportion of development costs recognised as assets in
2010 was 34.3% (2009: 44.4%).
Sales and administrative costs increased by 9.7% com-
pared to the previous year, equivalent to 9.1% of revenues
and therefore 0.8 percentage points lower on a year-to-
year comparison.
Depreciation and amortisation on property, plant and
equipment and intangible assets recorded in cost of sales
and in sales and administrative costs amounted to euro
3,682 million (2009: euro 3,600 million).
The net expense from other operating income and ex-
penses amounted to euro 292 million, a deterioration of
euro 296 million compared to the previous year. The
main reasons for this were the higher level of allocations
to provisions and the lower result on currency trans-
actions.
As a result of the positive factors referred to above, the
profit before financial result amounted to euro 5,094 mil-
lion (2009: euro 289 million).
The financial result was a net expense of euro 258 mil-
lion, a deterioration of euro 382 million against the pre-
vious year (2009: net income of euro 124 million). The
change was mainly attributable to the fact that net in-
come from investments was euro 172 million lower due
to impairment losses recognised on investments in sub-
sidiaries. Sundry other financial result deteriorated by
euro 149 million to euro 96 million, reflecting lower net
gains on stand-alone commodities derivatives. Within the
financial result, net interest expense increased by euro
123 million. By contrast, the result from equity-accounted
investments improved by euro 62 million to euro 98 mil-
lion. In addition to the Group’s share of results from its
equity-accounted investments in BMW Brilliance Auto-
motive Ltd., Shenyang, and the Cirquent Group, this also
includes for the first time the Group’s share of results
from joint ventures with the SGL Carbon Group.
Taking all these factors into consideration, the profit be-
fore tax improved to euro 4,836 million (2009: euro
413million). The pre-tax return on sales was 8.0% (2009:
0.8%).
The tax expense amounted to euro 1,602 million (2009:
euro 203 million), resulting in an effective tax rate of
33.1% (2009: 49.2%). The previous year’s high effective
tax rate was primarily attributable to tax expenses in-
curred in conjunction with a tax field audit at the level of
BMW AG.
Overall, the BMW Group recorded a net profit of euro
3,234 million (2009: euro 210 million) for the financial
year 2010. The post-tax return on sales was 5.3% (2009:
0.4%).
Revenues of the Automobiles segment rose by 23.8%.
The pre-tax segment result turned round from a seg-
mentloss before tax of euro 588 million in 2009 to a seg-
ment profit before tax of euro 3,887 million in 2010. The
number of cars sold increased by 13.6%, reflecting the
gradual expansion and rejuvenation of our model
port-
folio as well as dynamic growth in Asia.