BMW 2010 Annual Report Download - page 116
Download and view the complete annual report
Please find page 116 of the 2010 BMW annual report below. You can navigate through the pages in the report by either clicking on the pages listed below, or by using the keyword search tool below to find specific information within the annual report.-
 1
1 -
2
-
3
-
4
-
5
-
6
-
7
-
8
-
9
-
10
-
11
-
12
-
13
-
14
-
15
-
16
-
17
-
18
-
19
-
20
-
21
-
22
-
23
-
24
-
25
-
26
-
27
-
28
-
29
-
30
-
31
-
32
-
33
-
34
-
35
-
36
-
37
-
38
-
39
-
40
-
41
-
42
-
43
-
44
-
45
-
46
-
47
-
48
-
49
-
50
-
51
-
52
-
53
-
54
-
55
-
56
-
57
-
58
-
59
-
60
-
61
-
62
-
63
-
64
-
65
-
66
-
67
-
68
-
69
-
70
-
71
-
72
-
73
-
74
-
75
-
76
-
77
-
78
-
79
-
80
-
81
-
82
-
83
-
84
-
85
-
86
-
87
-
88
-
89
-
90
-
91
-
92
-
93
-
94
-
95
-
96
-
97
-
98
-
99
-
100
-
101
-
102
-
103
-
104
-
105
-
 106
106 -
 107
107 -
 108
108 -
 109
109 -
 110
110 -
 111
111 -
 112
112 -
 113
113 -
 114
114 -
 115
115 -
 116
116 -
 117
117 -
 118
118 -
 119
119 -
 120
120 -
 121
121 -
 122
122 -
 123
123 -
 124
124 -
 125
125 -
 126
126 -
127
-
128
-
129
-
130
-
131
-
132
-
133
-
134
-
135
-
136
-
137
-
138
-
139
-
140
-
141
-
142
-
143
-
144
-
145
-
146
-
147
-
148
-
149
-
150
-
151
-
152
-
153
-
154
-
155
-
156
-
157
-
158
-
159
-
160
-
161
-
162
-
163
-
164
-
165
-
166
-
167
-
168
-
169
-
170
-
171
-
172
-
173
-
174
-
175
-
176
-
177
-
178
-
179
-
180
-
181
-
182
-
183
-
184
-
185
-
186
-
187
-
188
-
189
-
190
-
191
-
192
-
193
-
194
-
195
-
196
-
197
-
198
-
199
-
200
-
201
-
202
-
203
-
204
-
205
-
206
-
207
-
208
-
209
-
210
-
211
-
212
-
213
-
214
-
215
-
216
-
217
-
218
-
219
-
220
-
221
-
222
-
223
-
224
-
225
-
226
-
227
-
228
-
229
-
230
-
231
-
232
-
233
-
234
-
235
-
236
-
237
-
238
-
239
-
240
-
241
-
242
-
243
-
244
-
245
-
246
-
247
-
248
-
249
-
250
-
251
-
252
-
253
-
254
-
255
-
256
-
257
-
258
-
259
-
260
-
261
-
262
-
263
-
264
-
265
-
266
-
267
-
268
-
269
-
270
-
271
-
272
-
273
-
274
-
275
-
276
-
277
-
278
-
279
-
280
-
281
-
282
 |
 |
114
74 GROUP FINANCIAL STATEMENTS
74 Income Statements
74 Statement of
Comprehensive Income
76 Balance Sheets
78 Cash Flow Statements
80 Group Statement of Changes
in Equity
81 Notes
81 Accounting Principles
and Policies
89 Notes to the Income
Statement
95 Notes to the Statement
of Comprehensive Income
96 Notes to the Balance Sheet
117 Other Disclosures
133 Segment Information
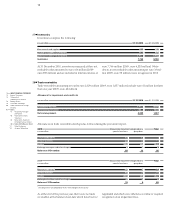
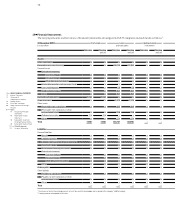
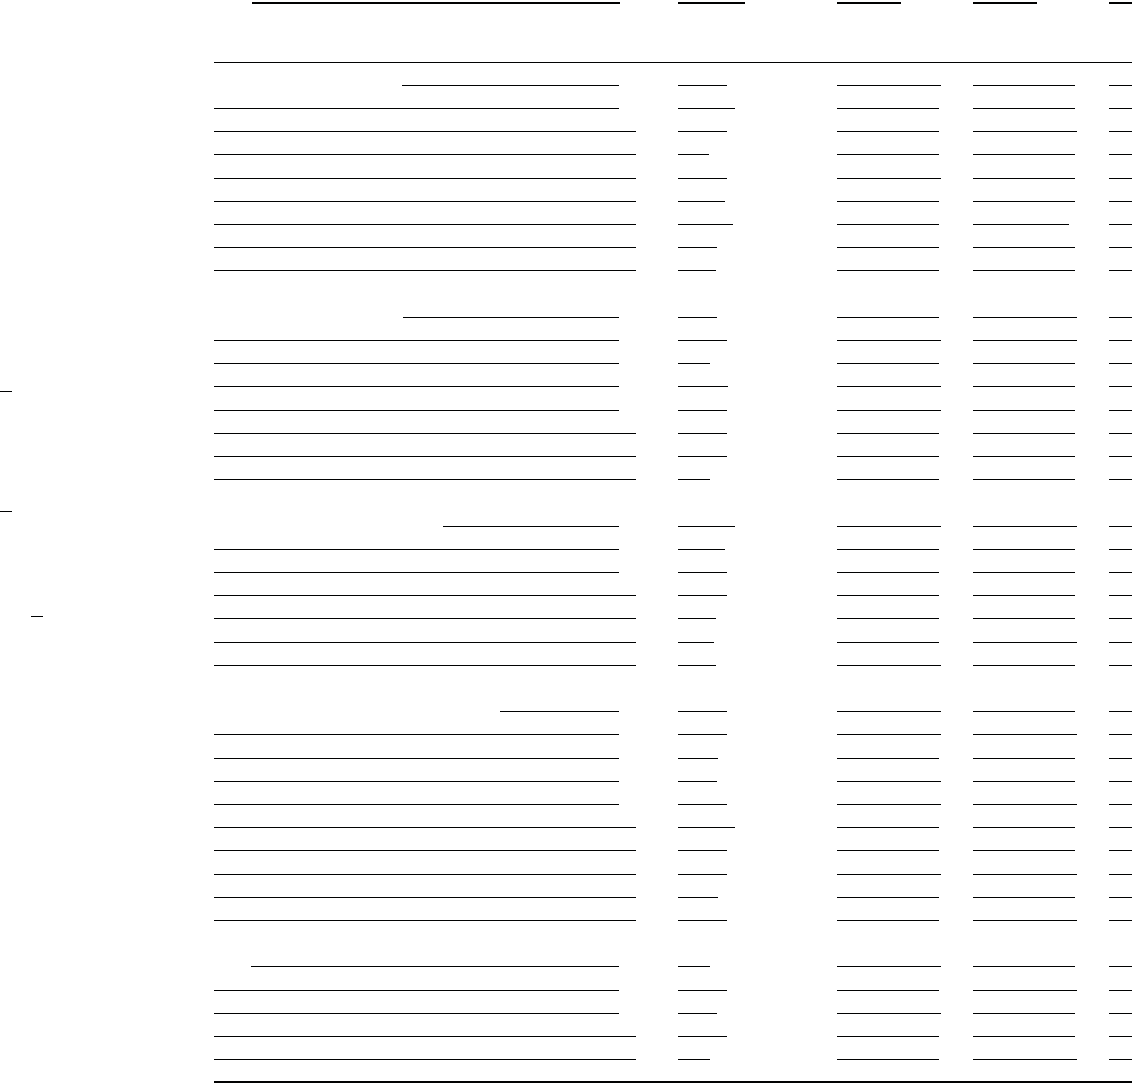
Bonds comprise:
Issuer Interest Issue volume Weighted Weighted
in relevant currency average maturity average effective
(ISO-Code) period (in years) interest rate (in %)
BMW Finance N. V., The Hague variable EUR 874 million 1.9 3.1
variable USD 90 million 2.1 0.8
fixed AUD 250 million 4.0 7.3
fixed EUR 12,820 million 5.8 4.8
fixed GBP 300 million 7.0 5.3
fixed NOK 450 million 4.0 5.8
fixed RON 44 million 3.0 11.4
fixed SEK 1,000 million 2.0 5.0
fixed USD 1,250 million 4.5 4.9
BMW (UK) Capital plc, Bracknell variable CZK 1,080 million 3.0 1.6
variable EUR 550 million 1.6 1.0
variable JPY 33,900 million 4.1 0.2
variable SEK 300 million 1.5 2.0
variable USD 100 million 1.5 0.3
fixed CHF 500 million 5.0 2.1
fixed GBP 300 million 8.0 5.0
fixed JPY 27,000 million 4.7 2.5
BMW US Capital, LLC, Wilmington, DE variable EUR 75 million 1.0 1.0
variable MXN 405 million 5.0 4.9
variable USD 633 million 2.4 0.3
fixed CHF 700 million 4.9 3.3
fixed EUR 4,000 million 6.3 5.5
fixed MXN 1,725 million 4.4 7.8
fixed USD 1,416 million 7.0 5.1
BMW Australia Finance Ltd., Melbourne, Victoria variable AUD 180 million 1.2 5.8
variable EUR 285 million 1.5 1.6
variable JPY 4,000 million 2.0 0.7
variable SEK 2,600 million 1.5 2.0
variable USD 375 million 1.9 1.1
fixed AUD 85 million 2.6 5.8
fixed CHF 450 million 4.1 2.1
fixed EUR 150 million 1.3 1.5
fixed JPY 8,000 million 2.0 0.9
fixed USD 100 million 2.5 1.1
Other variable JPY 14,600 million 1.3 0.2
variable USD 200 million 3.0 1.8
variable ZAR 2,500 million 1.8 6.7
fixed CAD 750 million 3.0 3.2
fixed JPY 33,600 million 3.5 1.1