BMW 2010 Annual Report Download - page 35
Download and view the complete annual report
Please find page 35 of the 2010 BMW annual report below. You can navigate through the pages in the report by either clicking on the pages listed below, or by using the keyword search tool below to find specific information within the annual report.-
 1
1 -
2
-
3
-
4
-
5
-
6
-
7
-
8
-
9
-
10
-
11
-
12
-
13
-
14
-
15
-
16
-
17
-
18
-
19
-
20
-
21
-
22
-
23
-
24
-
 25
25 -
 26
26 -
 27
27 -
 28
28 -
 29
29 -
 30
30 -
 31
31 -
 32
32 -
 33
33 -
 34
34 -
 35
35 -
 36
36 -
 37
37 -
 38
38 -
 39
39 -
 40
40 -
 41
41 -
 42
42 -
 43
43 -
 44
44 -
 45
45 -
46
-
47
-
48
-
49
-
50
-
51
-
52
-
53
-
54
-
55
-
56
-
57
-
58
-
59
-
60
-
61
-
62
-
63
-
64
-
65
-
66
-
67
-
68
-
69
-
70
-
71
-
72
-
73
-
74
-
75
-
76
-
77
-
78
-
79
-
80
-
81
-
82
-
83
-
84
-
85
-
86
-
87
-
88
-
89
-
90
-
91
-
92
-
93
-
94
-
95
-
96
-
97
-
98
-
99
-
100
-
101
-
102
-
103
-
104
-
105
-
106
-
107
-
108
-
109
-
110
-
111
-
112
-
113
-
114
-
115
-
116
-
117
-
118
-
119
-
120
-
121
-
122
-
123
-
124
-
125
-
126
-
127
-
128
-
129
-
130
-
131
-
132
-
133
-
134
-
135
-
136
-
137
-
138
-
139
-
140
-
141
-
142
-
143
-
144
-
145
-
146
-
147
-
148
-
149
-
150
-
151
-
152
-
153
-
154
-
155
-
156
-
157
-
158
-
159
-
160
-
161
-
162
-
163
-
164
-
165
-
166
-
167
-
168
-
169
-
170
-
171
-
172
-
173
-
174
-
175
-
176
-
177
-
178
-
179
-
180
-
181
-
182
-
183
-
184
-
185
-
186
-
187
-
188
-
189
-
190
-
191
-
192
-
193
-
194
-
195
-
196
-
197
-
198
-
199
-
200
-
201
-
202
-
203
-
204
-
205
-
206
-
207
-
208
-
209
-
210
-
211
-
212
-
213
-
214
-
215
-
216
-
217
-
218
-
219
-
220
-
221
-
222
-
223
-
224
-
225
-
226
-
227
-
228
-
229
-
230
-
231
-
232
-
233
-
234
-
235
-
236
-
237
-
238
-
239
-
240
-
241
-
242
-
243
-
244
-
245
-
246
-
247
-
248
-
249
-
250
-
251
-
252
-
253
-
254
-
255
-
256
-
257
-
258
-
259
-
260
-
261
-
262
-
263
-
264
-
265
-
266
-
267
-
268
-
269
-
270
-
271
-
272
-
273
-
274
-
275
-
276
-
277
-
278
-
279
-
280
-
281
-
282
 |
 |

33 GROUP MANAGEMENT REPORT
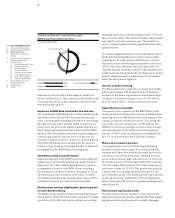
total, 49.5% of all new cars left the Group’s plants by rail,
2.5 percentage points up on the previous year (2009:
47.0%).
Sustainability of value-added chains
Our suppliers, too, are required to maintain the high eco-
logical and social standards set by the BMW Group. For
this reason we have drawn up more specific sustainability
criteria for the selection of suppliers and intensified su-
pervision of existing suppliers. The major focus was on
the evaluation and supervision of production locations of
our suppliers worldwide.
Consistent CO2 reduction with Efficient Dynamics
At an early stage the BMW Group adopted a development
strategy that is now generating tangible benefits for
climate, resources and customers alike. At the centre of
these endeavours is our Efficient Dynamics technology
package. Since March 2007 we have been introducing
consumption- and emissions-reducing technologies step
by step in all of our models as standard. Their positive
impact is now coming to fruition with every car sold and
not just for special models. The Efficient Dynamics tech-
nologies comprise:
– optimised engine and drive train engineering (e.g.
petrol engines featuring High Precision Injection,
TwinPower Turbo technology and particularly efficient
diesel engines)
– lightweight construction and optimised aerodynamics
(e.g. through the intelligent use of aluminium and
high-tensile steels)
– intelligent energy management (e.g. through Brake
Energy Regeneration and the Auto Start Stop function)
Our main guiding principle in all our endeavours is:
greater dynamism, less fuel consumption and fewer emis-
sions.
These developments have enabled us to reduce the
CO2 emissions of our newly sold cars in Europe (EU-15)
by 30% between 1995 and 2010, thereby more than
fulfilling
the commitment given by the European auto-
motive industry to reduce average CO
2
emissions
for
newfleets of cars by 25% between 1995 and 2008 (ACEA
self-commitment).
In 2010 our fleet achieved an average fuel consumption
of 5.4 litres of diesel /100 km, 6.6 litres of petrol /100 km
and average emissions of 148 g / km of CO2 in Europe
(EU-27). We also lead the field among German manufac-
turers with CO2 emissions of approximately 154 g / km.
These figures have confirmed our leading role in the
premium segment in Germany. Our progress in this field
is also receiving recognition from customers. Efficient
Dynamics have given us a competitive edge, particularly
in markets where a CO2-based vehicle tax is in place.
Therunning cost of cars fitted with Efficient Dynamics is
significantly lower than that of our competitors.
We have set ourselves a clear goal for the coming years:
reduction by at least a further 25% in the carbon dioxide
emissions of our cars during the period from 2008 to
2020. We are proceeding in a three-step strategy in or-
der
to achieve this goal and move towards sustainable
mobility:
1. We will continue unswervingly to develop our Efficient
Dynamics technology package.
2. We will increasingly exploit the potential of electrify-
ing the drive train to reduce fuel consumption and
include these developments in a broad range of
models.
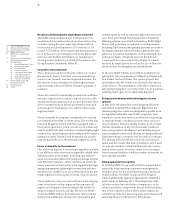
Water consumption1 per vehicle produced
in m3 / vehicle
3.20
3.00
2.80
2.60
2.40
2.20
06
2 07 08 09 10
2.99 2.61 2.56 2.56 2.31
1
The indicators for water consumption refer to the production sites of the BMW Group.
The water consumption includes the process water input for the production as well as
the general water consumption e.g. for sanitation facilities.
2 Value extrapolated for 17 locations. Actual reporting covered ten locations.
Process wastewater per vehicle produced
in m3 / vehicle
0.90
0.80
0.70
0.60
0.50
0.40
06
* 07 08 09 10
0.75 0.64 0.64 0.62 0.58
* Value extrapolated for 17 locations. Actual reporting covered ten locations.