BMW 2010 Annual Report Download - page 53
Download and view the complete annual report
Please find page 53 of the 2010 BMW annual report below. You can navigate through the pages in the report by either clicking on the pages listed below, or by using the keyword search tool below to find specific information within the annual report.-
 1
1 -
2
-
3
-
4
-
5
-
6
-
7
-
8
-
9
-
10
-
11
-
12
-
13
-
14
-
15
-
16
-
17
-
18
-
19
-
20
-
21
-
22
-
23
-
24
-
25
-
26
-
27
-
28
-
29
-
30
-
31
-
32
-
33
-
34
-
35
-
36
-
37
-
38
-
39
-
40
-
41
-
42
-
 43
43 -
 44
44 -
 45
45 -
 46
46 -
 47
47 -
 48
48 -
 49
49 -
 50
50 -
 51
51 -
 52
52 -
 53
53 -
 54
54 -
 55
55 -
 56
56 -
 57
57 -
 58
58 -
 59
59 -
 60
60 -
 61
61 -
 62
62 -
 63
63 -
64
-
65
-
66
-
67
-
68
-
69
-
70
-
71
-
72
-
73
-
74
-
75
-
76
-
77
-
78
-
79
-
80
-
81
-
82
-
83
-
84
-
85
-
86
-
87
-
88
-
89
-
90
-
91
-
92
-
93
-
94
-
95
-
96
-
97
-
98
-
99
-
100
-
101
-
102
-
103
-
104
-
105
-
106
-
107
-
108
-
109
-
110
-
111
-
112
-
113
-
114
-
115
-
116
-
117
-
118
-
119
-
120
-
121
-
122
-
123
-
124
-
125
-
126
-
127
-
128
-
129
-
130
-
131
-
132
-
133
-
134
-
135
-
136
-
137
-
138
-
139
-
140
-
141
-
142
-
143
-
144
-
145
-
146
-
147
-
148
-
149
-
150
-
151
-
152
-
153
-
154
-
155
-
156
-
157
-
158
-
159
-
160
-
161
-
162
-
163
-
164
-
165
-
166
-
167
-
168
-
169
-
170
-
171
-
172
-
173
-
174
-
175
-
176
-
177
-
178
-
179
-
180
-
181
-
182
-
183
-
184
-
185
-
186
-
187
-
188
-
189
-
190
-
191
-
192
-
193
-
194
-
195
-
196
-
197
-
198
-
199
-
200
-
201
-
202
-
203
-
204
-
205
-
206
-
207
-
208
-
209
-
210
-
211
-
212
-
213
-
214
-
215
-
216
-
217
-
218
-
219
-
220
-
221
-
222
-
223
-
224
-
225
-
226
-
227
-
228
-
229
-
230
-
231
-
232
-
233
-
234
-
235
-
236
-
237
-
238
-
239
-
240
-
241
-
242
-
243
-
244
-
245
-
246
-
247
-
248
-
249
-
250
-
251
-
252
-
253
-
254
-
255
-
256
-
257
-
258
-
259
-
260
-
261
-
262
-
263
-
264
-
265
-
266
-
267
-
268
-
269
-
270
-
271
-
272
-
273
-
274
-
275
-
276
-
277
-
278
-
279
-
280
-
281
-
282
 |
 |

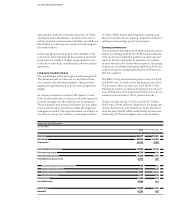
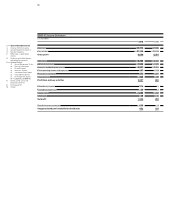
51 GROUP MANAGEMENT REPORT
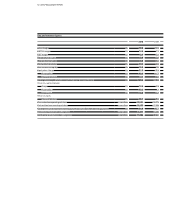
Revenues by segment
in euro million
2010 2009
Automobiles 54,137 43,737
Motorcycles 1,304 1,069
Financial Services 16,617 15,798
Other Entities 4 3
Eliminations –11,585 – 9,926
Group 60,477 50,681
Profit / loss before tax by segment
in euro million
2010 2009
Automobiles 3,887 – 588
Motorcycles 65 11
Financial Services 1,214 365
Other Entities 45 51
Eliminations – 375 574
Group 4,836 413
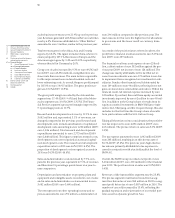
In the Motorcycles segment, the number of BMW motor-
cycles handed over to customers increased by 12.3%,
compared with a 22.0% increase in segment revenues.
The pre-tax segment result increased by euro 54 million
to euro 65 million.
Financial Services segment revenues grew by 5.2% to
euro 16,617 million. The pre-tax segment result climbed
to euro 1,214 million (2009: euro 365 million). The im-
provement mainly reflected lower expense for risk pro-
vision in the areas of credit financing and residual values
on the one hand and lower refinancing costs on the
other.
The Other Entities segment recorded a pre-tax profit of
euro 45 million (2009: euro 51 million).
The result from inter-segment eliminations was a net
expense of euro 375 million (2009: net income of euro
574 million), mainly reflecting the higher volume of new
leasing business and lower Group production costs.
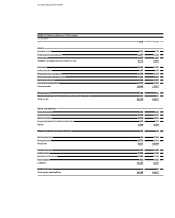
Financial position
The cash flow statements of the BMW Group and the
Automobiles and Financial Services segments show the
sources and applications of cash flows for the financial
years 2009 and 2010, classified into cash flows from oper-
ating, investing and financing activities. Cash and cash
equivalents in the cash flow statements correspond to the
amount disclosed in the balance sheet.
Cash flows from operating activities are determined indi-
rectly,
starting with Group and segment net profit. By
contrast, cash flows from investing and financing activities
are based on actual payments and receipts.
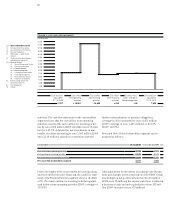
Operating activities of the BMW Group generated a
posi-
tive cash flow of euro 13,651 million in 2010, an increase
of euro 3,380 million or 32.9% compared to the previous
year. The higher net profit in 2010 accounted for euro
3,024 million of the increased cash inflow. Changes in
working capital reduced cash flows from operating activi-
ties by euro 2,205 million. This compared with changes
in other operating assets and liabilities (up by euro
1,466 million) and provisions (up by euro 910 million),
which resulted in an increase in the cash flow from oper-
ating activities.
The cash outflow for investing activities amounted to
euro 14,522 million and was therefore euro 3,194 million
higher than in 2009. Capital expenditure for intangible
assets and property, plant and equipment resulted in the
cash outflow for investing activities decreasing by euro
208 million compared to the corresponding period last
year. The cash outflow for the net investment in leased
products and receivables from sales financing increased
by euro 3,632 million to euro 9,332 million, primarily re-
flecting the higher level of new business recorded in the
Financial Services segment. The change in marketable
securities resulted in a euro 363 million decrease in cash
outflow.
Financing activities generated a cash inflow of euro
510million
in 2010, euro 842 million lower than in the
previous year (2009: cash inflow of euro 1,352 million).
Cash inflows from the issue of bonds totalled euro
4,578million (2009: euro 9,762 million), while euro
3,406 million (2009: euro 6,440 million) was used to
repay bonds. The dividend payment for the financial
year2010 amounted to euro 197 million. The cash out-
flow for other financial liabilities and commercial paper
was euro 260 million (2009: cash outflow of euro
1,562million).
94.0% (2009: 90.7%) of the cash outflow for investing
activities was covered by the cash inflow from operating