BMW 2010 Annual Report Download - page 56
Download and view the complete annual report
Please find page 56 of the 2010 BMW annual report below. You can navigate through the pages in the report by either clicking on the pages listed below, or by using the keyword search tool below to find specific information within the annual report.-
 1
1 -
2
-
3
-
4
-
5
-
6
-
7
-
8
-
9
-
10
-
11
-
12
-
13
-
14
-
15
-
16
-
17
-
18
-
19
-
20
-
21
-
22
-
23
-
24
-
25
-
26
-
27
-
28
-
29
-
30
-
31
-
32
-
33
-
34
-
35
-
36
-
37
-
38
-
39
-
40
-
41
-
42
-
43
-
44
-
45
-
 46
46 -
 47
47 -
 48
48 -
 49
49 -
 50
50 -
 51
51 -
 52
52 -
 53
53 -
 54
54 -
 55
55 -
 56
56 -
 57
57 -
 58
58 -
 59
59 -
 60
60 -
 61
61 -
 62
62 -
 63
63 -
 64
64 -
 65
65 -
 66
66 -
67
-
68
-
69
-
70
-
71
-
72
-
73
-
74
-
75
-
76
-
77
-
78
-
79
-
80
-
81
-
82
-
83
-
84
-
85
-
86
-
87
-
88
-
89
-
90
-
91
-
92
-
93
-
94
-
95
-
96
-
97
-
98
-
99
-
100
-
101
-
102
-
103
-
104
-
105
-
106
-
107
-
108
-
109
-
110
-
111
-
112
-
113
-
114
-
115
-
116
-
117
-
118
-
119
-
120
-
121
-
122
-
123
-
124
-
125
-
126
-
127
-
128
-
129
-
130
-
131
-
132
-
133
-
134
-
135
-
136
-
137
-
138
-
139
-
140
-
141
-
142
-
143
-
144
-
145
-
146
-
147
-
148
-
149
-
150
-
151
-
152
-
153
-
154
-
155
-
156
-
157
-
158
-
159
-
160
-
161
-
162
-
163
-
164
-
165
-
166
-
167
-
168
-
169
-
170
-
171
-
172
-
173
-
174
-
175
-
176
-
177
-
178
-
179
-
180
-
181
-
182
-
183
-
184
-
185
-
186
-
187
-
188
-
189
-
190
-
191
-
192
-
193
-
194
-
195
-
196
-
197
-
198
-
199
-
200
-
201
-
202
-
203
-
204
-
205
-
206
-
207
-
208
-
209
-
210
-
211
-
212
-
213
-
214
-
215
-
216
-
217
-
218
-
219
-
220
-
221
-
222
-
223
-
224
-
225
-
226
-
227
-
228
-
229
-
230
-
231
-
232
-
233
-
234
-
235
-
236
-
237
-
238
-
239
-
240
-
241
-
242
-
243
-
244
-
245
-
246
-
247
-
248
-
249
-
250
-
251
-
252
-
253
-
254
-
255
-
256
-
257
-
258
-
259
-
260
-
261
-
262
-
263
-
264
-
265
-
266
-
267
-
268
-
269
-
270
-
271
-
272
-
273
-
274
-
275
-
276
-
277
-
278
-
279
-
280
-
281
-
282
 |
 |

54
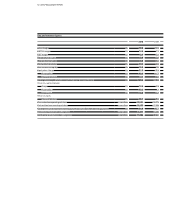
12 GROUP MANAGEMENT REPORT
12 A Review of the Financial Year
14 General Economic Environment
18 Review of Operations
41 BMW Group – Capital Market
Activities
44 Disclosures relevant for takeovers
and explanatory comments
47 Financial Analysis
47 Internal Management System
49 Earnings Performance
51 Financial Position
53 Net Assets Position
55 Subsequent Events Report
55 Value Added Statement
57 Key Performance Figures
58 Comments on BMW AG
62 Internal Control System and
explanatory comments
63 Risk Management
70 Outlook
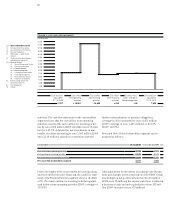
Liquid funds decreased by 4.4% to euro 8,998 million.
Liquid funds comprise cash and cash equivalents as well
as marketable securities and investment fund shares
(thelast two items reported as financial assets). Within
that item, marketable securities and investment fund
shares decreased by euro 82 million.
Cash and cash equivalents went down by euro 335 mil-
lion to euro 7,432 million.
On the equity and liabilities side of the balance sheet,
equity increased by euro 3,185 million (+16.0%) to euro
23,100 million, due to the net profit for the year (+
euro
3,234 million) and translation differences (+ euro
683 mil-
lion). Deferred taxes on fair value gains and losses
recog-
nised directly in equity increased equity by euro 263
mil-
lion. Group equity decreased as a result ofactuarial
losses on pension obligations resulting from lower inter-
est rates (– euro 277 million) and in conjunction with the
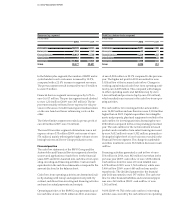
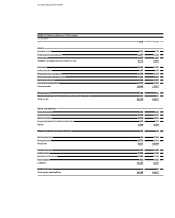
Balance sheet structure – Group
in euro billion
2010 2009 2009 2010
109 102 102 109
Non-current assets 60 %
8 %
39 %
61 %
36 %
44 %
20 %
40 %
Current assets
7 %
thereof cash and cash equivalents
42 % Non-current provisions and liabilities
37 % Current provisions and liabilities
21 % Equity
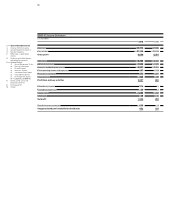
Balance sheet structure – Automobiles segment
in euro billion
2010 2009 2009 2010
59 53 53 59
Non-current assets 42 %
8 %
56 %
44 %
40 %
18 %
42 %
58 %
Current assets
10 %
thereof cash and cash equivalents
14 % Non-current provisions and liabilities
45 % Current provisions and liabilities
41 % Equity