BMW 2010 Annual Report Download - page 49
Download and view the complete annual report
Please find page 49 of the 2010 BMW annual report below. You can navigate through the pages in the report by either clicking on the pages listed below, or by using the keyword search tool below to find specific information within the annual report.
47 GROUP MANAGEMENT REPORT
Analysis of the Group Financial Statements
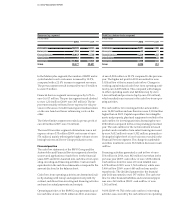
Group Internal Management System
Taking into account the interests and rights of capital pro-
viders represents the basis for value-based management
within the BMW Group. Only companies generating
profits on a sustainable basis that exceed the cost of equity
and debt capital employed are capable of ensuring con-
tinuous growth, an increase in value for capital providers,
jobs and, in the final analysis, corporate independence.
As part of the process of developing the Group’s manage-
ment system, “economic value added” has been intro-
duced at Group level as a new key performance indicator.
Value created represents a logical development of the
A positive value contribution means that a company is
earning more than its cost of capital. An increase or de-
crease in value contribution is an important measure of
financial success.
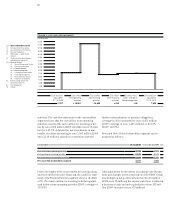
Cost of capital percentage for capital employed
The cost of capital percentage is calculated as a weighted
average of equity and debt capital costs using the standard
weighted average cost of capital (WACC) approach. Equity
capital costs are determined using the capital asset pric-
ing model (CAPM) and are based on the risk-free interest
rate plus the risk premium required by investors. The
risk premium is calculated on the basis of the market risk
premium and a beta factor. The beta factor is a measure
of a stock’s volatility in relation to the market. Interest
rates on debt capital are calculated as the average inter-
est rates relevant for long-term debt and pension obliga-
tions. The average cost of capital is calculated on the
basis of a long-term targeted capital structure, thus en-
suring stability in the way the business is managed in
the long term.
method currently in use for managing the efficient use of
capital based on the “return on capital employed” (ROCE).
Economic value = (
ROCE Group – cost of capital rate)
added Group x capital employed
The economic value added can also be presented as
earnings less the cost of capital.
Economic value = earnings amount–cost of capital=earnings
added Group amount–(cost of capital ratex capital
employed)
Return on capital used to measure value on a
periodic basis
Specific earnings and rate of return indicators are used
tomanage operational performance at segment and
Group level and measure performance by reporting
period. The period-related targets are monitored and
managed on a long-term basis in order to ensure that
earnings can develop at a steady pace. In line with the
method applied at Group level, the return on capital
employed is used as a profitability indicator for the Auto-
mobiles and Motor cycles segments. The Financial
Services segment is managed on the basis of the return
on equity (ROE). The ROE performance indicator is
important for the value-based management of the Finan-
cial Services segment because it focuses on equity as a
resource with limited availability and prioritises the effi-
cient utilisation of capital.
Profit before interest expense and tax
ROCE Group = Capital employed
ROCE
Automobiles
Profit before financial result
and Motorcycles = Capital employed
ROE Financial
Profit before tax
Services = Equity capital
Cost of capital rate (before tax)
in %
2010 2009
BMW Group 12 12
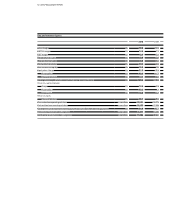
in euro million Earnings amount Cost of capital (EC + DC) Economic value added Group
2010 2009 2010 2009 2010 2009
BMW Group 5,203 922 3,187 3,351 2,016 – 2,429


