BMW 2010 Annual Report Download - page 18
Download and view the complete annual report
Please find page 18 of the 2010 BMW annual report below. You can navigate through the pages in the report by either clicking on the pages listed below, or by using the keyword search tool below to find specific information within the annual report.-
 1
1 -
2
-
3
-
4
-
5
-
6
-
7
-
 8
8 -
 9
9 -
 10
10 -
 11
11 -
 12
12 -
 13
13 -
 14
14 -
 15
15 -
 16
16 -
 17
17 -
 18
18 -
 19
19 -
 20
20 -
 21
21 -
 22
22 -
 23
23 -
 24
24 -
 25
25 -
 26
26 -
 27
27 -
 28
28 -
29
-
30
-
31
-
32
-
33
-
34
-
35
-
36
-
37
-
38
-
39
-
40
-
41
-
42
-
43
-
44
-
45
-
46
-
47
-
48
-
49
-
50
-
51
-
52
-
53
-
54
-
55
-
56
-
57
-
58
-
59
-
60
-
61
-
62
-
63
-
64
-
65
-
66
-
67
-
68
-
69
-
70
-
71
-
72
-
73
-
74
-
75
-
76
-
77
-
78
-
79
-
80
-
81
-
82
-
83
-
84
-
85
-
86
-
87
-
88
-
89
-
90
-
91
-
92
-
93
-
94
-
95
-
96
-
97
-
98
-
99
-
100
-
101
-
102
-
103
-
104
-
105
-
106
-
107
-
108
-
109
-
110
-
111
-
112
-
113
-
114
-
115
-
116
-
117
-
118
-
119
-
120
-
121
-
122
-
123
-
124
-
125
-
126
-
127
-
128
-
129
-
130
-
131
-
132
-
133
-
134
-
135
-
136
-
137
-
138
-
139
-
140
-
141
-
142
-
143
-
144
-
145
-
146
-
147
-
148
-
149
-
150
-
151
-
152
-
153
-
154
-
155
-
156
-
157
-
158
-
159
-
160
-
161
-
162
-
163
-
164
-
165
-
166
-
167
-
168
-
169
-
170
-
171
-
172
-
173
-
174
-
175
-
176
-
177
-
178
-
179
-
180
-
181
-
182
-
183
-
184
-
185
-
186
-
187
-
188
-
189
-
190
-
191
-
192
-
193
-
194
-
195
-
196
-
197
-
198
-
199
-
200
-
201
-
202
-
203
-
204
-
205
-
206
-
207
-
208
-
209
-
210
-
211
-
212
-
213
-
214
-
215
-
216
-
217
-
218
-
219
-
220
-
221
-
222
-
223
-
224
-
225
-
226
-
227
-
228
-
229
-
230
-
231
-
232
-
233
-
234
-
235
-
236
-
237
-
238
-
239
-
240
-
241
-
242
-
243
-
244
-
245
-
246
-
247
-
248
-
249
-
250
-
251
-
252
-
253
-
254
-
255
-
256
-
257
-
258
-
259
-
260
-
261
-
262
-
263
-
264
-
265
-
266
-
267
-
268
-
269
-
270
-
271
-
272
-
273
-
274
-
275
-
276
-
277
-
278
-
279
-
280
-
281
-
282
 |
 |

16
12 GROUP MANAGEMENT REPORT
12 A Review of the Financial Year
14 General Economic Environment
18 Review of Operations
41 BMW Group – Capital Market
Activities
44 Disclosures relevant for takeovers
and explanatory comments
47 Financial Analysis
47 Internal Management System
49 Earnings Performance
51 Financial Position
53 Net Assets Position
55 Subsequent Events Report
55 Value Added Statement
57 Key Performance Figures
58 Comments on BMW AG
62 Internal Control System and
explanatory comments
63 Risk Management
70 Outlook
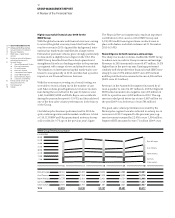
ment opportunities. Prices of both non-ferrous and pre-
cious metals also rose, in some cases substantially. The
price of oil increased from US dollar 80 per barrel at the
start of the year to US dollar 92 on the last day of trading.
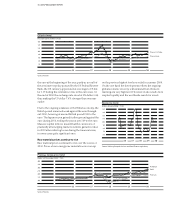
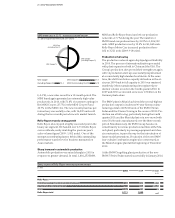
Car markets in 2010
Thanks to the worldwide recovery, the market for pas-
senger cars and light commercial vehicles again grew
sharply in 2010, rising from 63.8 million to 69.6 million
units (+9.2%). China increasingly confirmed its position
the as largest car market, the designation it had gained
in 2009. The Chinese market as a whole leapt from
13.6million to 18.1 million units (+32.4%), while the
USA, formerly the world’s largest car market, grew
byarobust but still significantly lower rate of 11.1%
withsales up from 10.4 million units to 11.6 million
units.
The differing expiry times of the various stimulus
pro-
grammes previously in place across the European Union
created a very diverse picture on national markets.
Overall, demand fell throughout the region by a further
5.5% in 2010 to 13.4 million vehicles, mainly due to the
slump in passenger car sales in Germany following the
expiry of the scrappage bonus scheme at the end of 2009.
Despite positive economic developments, the number
ofnewly registered passenger vehicles fell by about one
quarter to 2.9 million units. The French and Italian car
markets also contracted for the same reason. Sales of
passenger cars in France fell by 2.2% to 2.3 million units
and in Italy by 9.2% to 2.0 million units.
Most of the other countries managed to record slight
growth. New vehicle sales in the UK, for instance, rose by
1.8% to 2.0 million units and in Spain by 3.1% to
almost
1 million units. On the other hand, Eastern European
EUcountries recorded a further decline, with vehicle
sales
down by 3.2% to 0.8 million units.
The Japanese car market benefited from the scrappage
scheme that remained in place into 2010, with vehicle
sales up by 7.5% to 5.0 million.
Emerging markets performed very positively in 2010,
albeit at different rates. In Russia, the market grew by
one-
third to reach 1.8 million vehicles, partially offsetting
theslump experienced in 2009. The Indian market also
registered a similar high growth rate (2.8 million units;
+35.7%). Bycontrast, the car market in Brazil grew by only
8% to 3.2 million units.
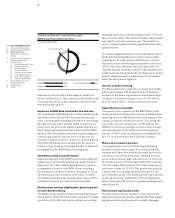
Motorcycle markets in 2010
The world’s motorcycle markets in the 500 cc plus class
relevant for the BMW Group were 11.7% down on the
previous year. In Europe most markets registered lower
figures than those of the previous year (–10.3%). The
German market for 500 cc plus motorcycles fell by 7.2%.
Shortfalls against the previous year were also recorded
in
Italy (–14.8%), France (–7.1%) and the UK (–17.8%)
.
Spain was the only market to show an upward trend, re-
bounding with a 3.0% increase in response to the ex-
tremely steep drop recorded the previous year. The mar-
kets for 500 cc plus motorcycles also failed to recover in
the USA (– 14.2%) and Japan (–6.3%) in 2010. There are
no reliable figures available for the engine-capacity seg-
ments relevant for the Husqvarna brand, as most of these
motorcycles are used for sporting and off-road activities
and therefore not included in registration statistics.
Financial Services market in 2010
The financial services sector also benefited from the
relatively speedy end to the worldwide recession. Even
so, the effects of the crisis could still be felt in 2010.
Substantial write-downs by banks and more rigorous
equity and liquidity requirements due to Basel III
regula-
tions dominated the financial system. Greece and Ireland
were obliged to accept financial support from the EU and
the International Monetary Fund. Although the money
and capital markets reacted nervously to these develop-
ments,
risk spreads only widened for a short period of
time. Overall, risk spreads narrowed slightly in 2010, with-
out
returning to the levels prevailing before the crisis.
Reference interest rates in most industrial countries re-
mained at historically low levels during 2010. The Bank
of Japan lowered its overnight interest rate in October
bya further 20 basis points, thus ranging from 0% to
0.10%. China, on the other hand, raised its reference rate
during the year by 25 basis points, to 5.81% and has
implemented further measures to subdue inflationary
pressures. Similarly, the central banks of Canada and
Australia raised
their reference rates in autumn by 25 ba-
sis points to 1.00%
and 4.75% respectively. In contrast,
the prospect of continuing low reference rates in the euro
region caused interest rates for contracts with medium-
term maturities to fall slightly.