BMW 2010 Annual Report Download - page 54
Download and view the complete annual report
Please find page 54 of the 2010 BMW annual report below. You can navigate through the pages in the report by either clicking on the pages listed below, or by using the keyword search tool below to find specific information within the annual report.-
 1
1 -
2
-
3
-
4
-
5
-
6
-
7
-
8
-
9
-
10
-
11
-
12
-
13
-
14
-
15
-
16
-
17
-
18
-
19
-
20
-
21
-
22
-
23
-
24
-
25
-
26
-
27
-
28
-
29
-
30
-
31
-
32
-
33
-
34
-
35
-
36
-
37
-
38
-
39
-
40
-
41
-
42
-
43
-
 44
44 -
 45
45 -
 46
46 -
 47
47 -
 48
48 -
 49
49 -
 50
50 -
 51
51 -
 52
52 -
 53
53 -
 54
54 -
 55
55 -
 56
56 -
 57
57 -
 58
58 -
 59
59 -
 60
60 -
 61
61 -
 62
62 -
 63
63 -
 64
64 -
65
-
66
-
67
-
68
-
69
-
70
-
71
-
72
-
73
-
74
-
75
-
76
-
77
-
78
-
79
-
80
-
81
-
82
-
83
-
84
-
85
-
86
-
87
-
88
-
89
-
90
-
91
-
92
-
93
-
94
-
95
-
96
-
97
-
98
-
99
-
100
-
101
-
102
-
103
-
104
-
105
-
106
-
107
-
108
-
109
-
110
-
111
-
112
-
113
-
114
-
115
-
116
-
117
-
118
-
119
-
120
-
121
-
122
-
123
-
124
-
125
-
126
-
127
-
128
-
129
-
130
-
131
-
132
-
133
-
134
-
135
-
136
-
137
-
138
-
139
-
140
-
141
-
142
-
143
-
144
-
145
-
146
-
147
-
148
-
149
-
150
-
151
-
152
-
153
-
154
-
155
-
156
-
157
-
158
-
159
-
160
-
161
-
162
-
163
-
164
-
165
-
166
-
167
-
168
-
169
-
170
-
171
-
172
-
173
-
174
-
175
-
176
-
177
-
178
-
179
-
180
-
181
-
182
-
183
-
184
-
185
-
186
-
187
-
188
-
189
-
190
-
191
-
192
-
193
-
194
-
195
-
196
-
197
-
198
-
199
-
200
-
201
-
202
-
203
-
204
-
205
-
206
-
207
-
208
-
209
-
210
-
211
-
212
-
213
-
214
-
215
-
216
-
217
-
218
-
219
-
220
-
221
-
222
-
223
-
224
-
225
-
226
-
227
-
228
-
229
-
230
-
231
-
232
-
233
-
234
-
235
-
236
-
237
-
238
-
239
-
240
-
241
-
242
-
243
-
244
-
245
-
246
-
247
-
248
-
249
-
250
-
251
-
252
-
253
-
254
-
255
-
256
-
257
-
258
-
259
-
260
-
261
-
262
-
263
-
264
-
265
-
266
-
267
-
268
-
269
-
270
-
271
-
272
-
273
-
274
-
275
-
276
-
277
-
278
-
279
-
280
-
281
-
282
 |
 |

52
12 GROUP MANAGEMENT REPORT
12 A Review of the Financial Year
14 General Economic Environment
18 Review of Operations
41 BMW Group – Capital Market
Activities
44 Disclosures relevant for takeovers
and explanatory comments
47 Financial Analysis
47 Internal Management System
49 Earnings Performance
51 Financial Position
53 Net Assets Position
55 Subsequent Events Report
55 Value Added Statement
57 Key Performance Figures
58 Comments on BMW AG
62 Internal Control System and
explanatory comments
63 Risk Management
70 Outlook
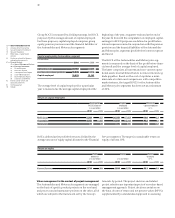
activities. The cash flow statement for the Automobiles
segment shows that the cash inflow from operating
activities exceeded the cash outflow for investing activi-
ties by euro 2,608 million (2009: shortfall of euro 754 mil-
lion)
or 147.1%. Adjusted for net investments in
mar-
ketable securities amounting to euro 1,863 million (2009:
euro 2,210 million), mainly in connection with the
further externalisation of pension obligations,
coverage
in 2010
amounted to euro 4,471 million
(2009: coverage of euro 1,456 million) or 221.5%
(2009:
142.0%).
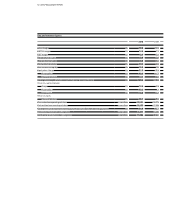
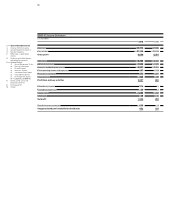
Free cash flow of the Automobiles segment can be
analysed as follows:
Due to the higher level of investment in leased products
and receivables from sales financing, the cash flow
state-
ment of the Financial Services segment shows a shortfall
of 59.1% of cash outflow for investing activities against
cash inflows from operating activities (2009: coverage of
115.8%).
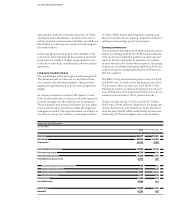
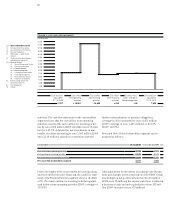
After adjustment for the effects of exchange-rate fluctua-
tions and changes in the composition of the BMW Group
amounting to a net positive amount of euro 26 million
(2009: euro 18 million), the various cash flows resulted in
a decrease in cash and cash equivalents of euro 335 mil-
lion (2009: increase of euro 313 million).
in euro million 31. 12. 2010 31. 12. 2009
Cash inflow from operating activities 8,150 4,921
Cash outflow for investing activities – 5,542 – 5,675
Net investment in marketable securities 1,863 2,210
Free cash flow Automobiles segment 4,471 1,456
Change in cash and cash equivalents
in euro million
22,500
21,000
19,500
18,000
16,500
15,000
13,500
12,000
10,500
9,000
7,500
6,000
4,500
3,000
1,500
Cash and cash Cash inflow Cash outflow Cash inflow Currency trans- Cash and cash
equivalents from operating from investing from financing lation, changes in equivalents
31.12.2009 activities activities activities Group composition 31.12.2010
7,767 + 13,651 – 14,522 + 510 + 26 7,432