BMW 2010 Annual Report Download - page 58
Download and view the complete annual report
Please find page 58 of the 2010 BMW annual report below. You can navigate through the pages in the report by either clicking on the pages listed below, or by using the keyword search tool below to find specific information within the annual report.-
 1
1 -
2
-
3
-
4
-
5
-
6
-
7
-
8
-
9
-
10
-
11
-
12
-
13
-
14
-
15
-
16
-
17
-
18
-
19
-
20
-
21
-
22
-
23
-
24
-
25
-
26
-
27
-
28
-
29
-
30
-
31
-
32
-
33
-
34
-
35
-
36
-
37
-
38
-
39
-
40
-
41
-
42
-
43
-
44
-
45
-
46
-
47
-
 48
48 -
 49
49 -
 50
50 -
 51
51 -
 52
52 -
 53
53 -
 54
54 -
 55
55 -
 56
56 -
 57
57 -
 58
58 -
 59
59 -
 60
60 -
 61
61 -
 62
62 -
 63
63 -
 64
64 -
 65
65 -
 66
66 -
 67
67 -
 68
68 -
69
-
70
-
71
-
72
-
73
-
74
-
75
-
76
-
77
-
78
-
79
-
80
-
81
-
82
-
83
-
84
-
85
-
86
-
87
-
88
-
89
-
90
-
91
-
92
-
93
-
94
-
95
-
96
-
97
-
98
-
99
-
100
-
101
-
102
-
103
-
104
-
105
-
106
-
107
-
108
-
109
-
110
-
111
-
112
-
113
-
114
-
115
-
116
-
117
-
118
-
119
-
120
-
121
-
122
-
123
-
124
-
125
-
126
-
127
-
128
-
129
-
130
-
131
-
132
-
133
-
134
-
135
-
136
-
137
-
138
-
139
-
140
-
141
-
142
-
143
-
144
-
145
-
146
-
147
-
148
-
149
-
150
-
151
-
152
-
153
-
154
-
155
-
156
-
157
-
158
-
159
-
160
-
161
-
162
-
163
-
164
-
165
-
166
-
167
-
168
-
169
-
170
-
171
-
172
-
173
-
174
-
175
-
176
-
177
-
178
-
179
-
180
-
181
-
182
-
183
-
184
-
185
-
186
-
187
-
188
-
189
-
190
-
191
-
192
-
193
-
194
-
195
-
196
-
197
-
198
-
199
-
200
-
201
-
202
-
203
-
204
-
205
-
206
-
207
-
208
-
209
-
210
-
211
-
212
-
213
-
214
-
215
-
216
-
217
-
218
-
219
-
220
-
221
-
222
-
223
-
224
-
225
-
226
-
227
-
228
-
229
-
230
-
231
-
232
-
233
-
234
-
235
-
236
-
237
-
238
-
239
-
240
-
241
-
242
-
243
-
244
-
245
-
246
-
247
-
248
-
249
-
250
-
251
-
252
-
253
-
254
-
255
-
256
-
257
-
258
-
259
-
260
-
261
-
262
-
263
-
264
-
265
-
266
-
267
-
268
-
269
-
270
-
271
-
272
-
273
-
274
-
275
-
276
-
277
-
278
-
279
-
280
-
281
-
282
 |
 |

56
12 GROUP MANAGEMENT REPORT
12 A Review of the Financial Year
14 General Economic Environment
18 Review of Operations
41 BMW Group – Capital Market
Activities
44 Disclosures relevant for takeovers
and explanatory comments
47 Financial Analysis
47 Internal Management System
49 Earnings Performance
51 Financial Position
53 Net Assets Position
55 Subsequent Events Report
55 Value Added Statement
57 Key Performance Figures
58 Comments on BMW AG
62 Internal Control System and
explanatory comments
63 Risk Management
70 Outlook
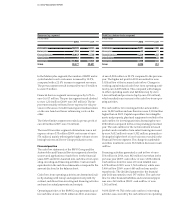
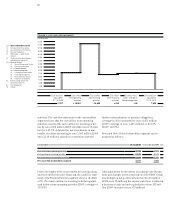
BMW Group Value added statement
2010 2010 2009 2009 Change
in euro million in % in euro million in % in %
Work performed
Revenues 60,477 98.7 50,681 97.5
Financial income and expenses – 7 – 488 0.9
Other income 766 1.3 808 1.6
Total output 61,236 100.0 51,977 100.0 17.8
Cost of materials 32,108 52.4 27,399 52.7
Other expenses* 7,548 12.4 6,845 13.2
Bought-in costs 39,656 64.8 34,244 65.9 15.8
Gross value added 21,580 35.2 17,733 34.1 21.7
Depreciation and amortisation 6,678 10.9 7,292 14.0
Net value added 14,902 24.3 10,441 20.1 42.7
Applied to
Employees 7,278 48.8 6,395 61.2 13.8
Providers of finance 2,363 15.9 3,243 31.1 – 27.1
Government / public sector 2,027 13.6 593 5.7 –
Shareholders 852 5.7 197 1.9 –
Group 2,366 15.9 7 0.1 –
Minority interest 16 0.1 6 – –
Net value added 14,902 100.0 10,441 100.0 42.7
* including expenses incurred to downsize the workforce
BMW Group Value added 2010
in %
Net value added 24.3 Depreciation and amortisation 10.9
Cost of materials 52.4 Other expenses 12.4
Other expenses
Net value added
Cost of materials
Depreciation and amortisation
48.8 % Employees
15.9 % Providers of finance
13.6 % Government / public sector
5.7 % Shareholders
15.9 % Group
0.1 % Other shareholders