BMW 2010 Annual Report Download - page 34
Download and view the complete annual report
Please find page 34 of the 2010 BMW annual report below. You can navigate through the pages in the report by either clicking on the pages listed below, or by using the keyword search tool below to find specific information within the annual report.-
 1
1 -
2
-
3
-
4
-
5
-
6
-
7
-
8
-
9
-
10
-
11
-
12
-
13
-
14
-
15
-
16
-
17
-
18
-
19
-
20
-
21
-
22
-
23
-
 24
24 -
 25
25 -
 26
26 -
 27
27 -
 28
28 -
 29
29 -
 30
30 -
 31
31 -
 32
32 -
 33
33 -
 34
34 -
 35
35 -
 36
36 -
 37
37 -
 38
38 -
 39
39 -
 40
40 -
 41
41 -
 42
42 -
 43
43 -
 44
44 -
45
-
46
-
47
-
48
-
49
-
50
-
51
-
52
-
53
-
54
-
55
-
56
-
57
-
58
-
59
-
60
-
61
-
62
-
63
-
64
-
65
-
66
-
67
-
68
-
69
-
70
-
71
-
72
-
73
-
74
-
75
-
76
-
77
-
78
-
79
-
80
-
81
-
82
-
83
-
84
-
85
-
86
-
87
-
88
-
89
-
90
-
91
-
92
-
93
-
94
-
95
-
96
-
97
-
98
-
99
-
100
-
101
-
102
-
103
-
104
-
105
-
106
-
107
-
108
-
109
-
110
-
111
-
112
-
113
-
114
-
115
-
116
-
117
-
118
-
119
-
120
-
121
-
122
-
123
-
124
-
125
-
126
-
127
-
128
-
129
-
130
-
131
-
132
-
133
-
134
-
135
-
136
-
137
-
138
-
139
-
140
-
141
-
142
-
143
-
144
-
145
-
146
-
147
-
148
-
149
-
150
-
151
-
152
-
153
-
154
-
155
-
156
-
157
-
158
-
159
-
160
-
161
-
162
-
163
-
164
-
165
-
166
-
167
-
168
-
169
-
170
-
171
-
172
-
173
-
174
-
175
-
176
-
177
-
178
-
179
-
180
-
181
-
182
-
183
-
184
-
185
-
186
-
187
-
188
-
189
-
190
-
191
-
192
-
193
-
194
-
195
-
196
-
197
-
198
-
199
-
200
-
201
-
202
-
203
-
204
-
205
-
206
-
207
-
208
-
209
-
210
-
211
-
212
-
213
-
214
-
215
-
216
-
217
-
218
-
219
-
220
-
221
-
222
-
223
-
224
-
225
-
226
-
227
-
228
-
229
-
230
-
231
-
232
-
233
-
234
-
235
-
236
-
237
-
238
-
239
-
240
-
241
-
242
-
243
-
244
-
245
-
246
-
247
-
248
-
249
-
250
-
251
-
252
-
253
-
254
-
255
-
256
-
257
-
258
-
259
-
260
-
261
-
262
-
263
-
264
-
265
-
266
-
267
-
268
-
269
-
270
-
271
-
272
-
273
-
274
-
275
-
276
-
277
-
278
-
279
-
280
-
281
-
282
 |
 |

32
12 GROUP MANAGEMENT REPORT
12 A Review of the Financial Year
14 General Economic Environment
18 Review of Operations
41 BMW Group – Capital Market
Activities
44 Disclosures relevant for takeovers
and explanatory comments
47 Financial Analysis
47 Internal Management System
49 Earnings Performance
51 Financial Position
53 Net Assets Position
55 Subsequent Events Report
55 Value Added Statement
57 Key Performance Figures
58 Comments on BMW AG
62 Internal Control System and
explanatory comments
63 Risk Management
70 Outlook
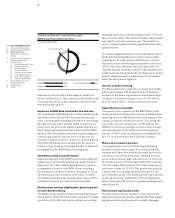
powers its fleet of forklift trucks by hydrogen. A solar
thermal plant installed at the BMW plant in Rosslyn
heats the water needed for the paint shop. At the Research
and Innovation Centre (FIZ) in Munich, the low tempera-
ture of the groundwater is used for air conditioning pur-
poses. Furthermore, at certain production sites the BMW
Group operates its own combined heat and power plants
that make particularly efficient use of resources.
Less water, less wastewater
Despite higher production volumes, the BMW Group has
reduced its water consumption by 370,000 m
3
compared
with the previous year. 2.31 m3 of water were consumed
per vehicle produced (–9.8%). The total amount of
process water used was reduced by 60,000 m
3
(–6.5%).
New technologies have contributed towards the improve-
ment,
such as “snow cleaning”, an innovative process
developed at the BMW Landshut plant, in which plastic
parts such as bumpers and wing mirrors are no longer
cleaned with water and detergents during production
butwith snow made from frozen carbon dioxide. The CO
2
is completely recovered and reused.
Waste and solvent emissions further reduced
The amount of non-recyclable production waste was de-
creased by a further 5.1% in 2010, as a result of which
only 10.09 kg of non-recyclable waste accumulated per
vehicle produced (2009: 10.63 kg). After successfully de-
creasing the amount by 28% the previous year, we have
meanwhile developed better ways of recycling waste
andusing materials more efficiently.
The BMW Group was able to reduce its solvent emissions
(VOC) by around 10% in 2010, bringing emissions per
vehicle produced down to 1.60 kg (2009: 1.77 kg). This
reduction was partly achieved through the use of low-
solvent and solvent-free rinsing and cleaning processes
in the painting pre-treatment process. Optimised colour-
change cycles in the paint shop further reduced the
number of cleaning processes required. Solvent
emis-
sions have been reduced by more than 30% since 2006,
so that we have already reached the target set for 2012.
Clean production in Shenyang
We are currently building a further plant in Shenyang,
China. Numerous ecological and social criteria were
taken into account when selecting the site of the new
plant. At the planning stage the location of the plant on
high ground was also chosen to compensate for any
future climatic changes and thus protect it from possible
flooding. A further criterion when deciding for the lo-
cation was the basic availability of renewable energy
sources. The paint shop will be the most sustainable fa-
cility in the entire BMW Group production network.
Eco-friendly transportation solutions
We also reduced the environmental impact of our freight
transportation in 2010 by optimising transportation net-
works. Regional shifts in sales volume resulted in changes
in the proportion of goods transported by each mode. At
0.5%, the percentage of goods transported by air freight
during the reporting year again remained very low (2009:
0.2%). Growth in China caused an increase in the per-
centage of sea freight to 79.9% (2009: 78.0%). The pro-
portion of goods transported by rail rose slightly to 6.3%
in 2010 (2009: 6.0%). Conversely, the percentage trans-
ported by road fell to 13.3% (2009: 15.8%).
Sales volume performance is also reflected in the distri-
bution of transportation methods for our new cars: in
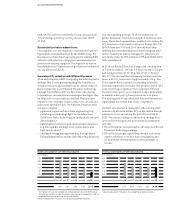
Energy consumed per vehicle produced
in MWh / vehicle
3.40
3.20
3.00
2.80
2.60
2.40
06
* 07 08 09 10
3.28 2.78 2.80 2.89 2.75
* Value extrapolated for 17 locations. Actual reporting covered ten locations.
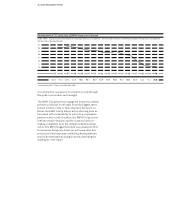
CO2 emissions per vehicle produced
in t / vehicle
1.00
0.95
0.90
0.85
0.80
0.75
06
* 07 08 09 10
0.96 0.84 0.82 0.91 0.86
* Value extrapolated for 17 locations. Actual reporting covered ten locations.