BMW 2010 Annual Report Download - page 20
Download and view the complete annual report
Please find page 20 of the 2010 BMW annual report below. You can navigate through the pages in the report by either clicking on the pages listed below, or by using the keyword search tool below to find specific information within the annual report.-
 1
1 -
2
-
3
-
4
-
5
-
6
-
7
-
8
-
9
-
 10
10 -
 11
11 -
 12
12 -
 13
13 -
 14
14 -
 15
15 -
 16
16 -
 17
17 -
 18
18 -
 19
19 -
 20
20 -
 21
21 -
 22
22 -
 23
23 -
 24
24 -
 25
25 -
 26
26 -
 27
27 -
 28
28 -
 29
29 -
 30
30 -
31
-
32
-
33
-
34
-
35
-
36
-
37
-
38
-
39
-
40
-
41
-
42
-
43
-
44
-
45
-
46
-
47
-
48
-
49
-
50
-
51
-
52
-
53
-
54
-
55
-
56
-
57
-
58
-
59
-
60
-
61
-
62
-
63
-
64
-
65
-
66
-
67
-
68
-
69
-
70
-
71
-
72
-
73
-
74
-
75
-
76
-
77
-
78
-
79
-
80
-
81
-
82
-
83
-
84
-
85
-
86
-
87
-
88
-
89
-
90
-
91
-
92
-
93
-
94
-
95
-
96
-
97
-
98
-
99
-
100
-
101
-
102
-
103
-
104
-
105
-
106
-
107
-
108
-
109
-
110
-
111
-
112
-
113
-
114
-
115
-
116
-
117
-
118
-
119
-
120
-
121
-
122
-
123
-
124
-
125
-
126
-
127
-
128
-
129
-
130
-
131
-
132
-
133
-
134
-
135
-
136
-
137
-
138
-
139
-
140
-
141
-
142
-
143
-
144
-
145
-
146
-
147
-
148
-
149
-
150
-
151
-
152
-
153
-
154
-
155
-
156
-
157
-
158
-
159
-
160
-
161
-
162
-
163
-
164
-
165
-
166
-
167
-
168
-
169
-
170
-
171
-
172
-
173
-
174
-
175
-
176
-
177
-
178
-
179
-
180
-
181
-
182
-
183
-
184
-
185
-
186
-
187
-
188
-
189
-
190
-
191
-
192
-
193
-
194
-
195
-
196
-
197
-
198
-
199
-
200
-
201
-
202
-
203
-
204
-
205
-
206
-
207
-
208
-
209
-
210
-
211
-
212
-
213
-
214
-
215
-
216
-
217
-
218
-
219
-
220
-
221
-
222
-
223
-
224
-
225
-
226
-
227
-
228
-
229
-
230
-
231
-
232
-
233
-
234
-
235
-
236
-
237
-
238
-
239
-
240
-
241
-
242
-
243
-
244
-
245
-
246
-
247
-
248
-
249
-
250
-
251
-
252
-
253
-
254
-
255
-
256
-
257
-
258
-
259
-
260
-
261
-
262
-
263
-
264
-
265
-
266
-
267
-
268
-
269
-
270
-
271
-
272
-
273
-
274
-
275
-
276
-
277
-
278
-
279
-
280
-
281
-
282
 |
 |
18
12 GROUP MANAGEMENT REPORT
12 A Review of the Financial Year
14 General Economic Environment
18 Review of Operations
41 BMW Group – Capital Market
Activities
44 Disclosures relevant for takeovers
and explanatory comments
47 Financial Analysis
47 Internal Management System
49 Earnings Performance
51 Financial Position
53 Net Assets Position
55 Subsequent Events Report
55 Value Added Statement
57 Key Performance Figures
58 Comments on BMW AG
62 Internal Control System and
explanatory comments
63 Risk Management
70 Outlook
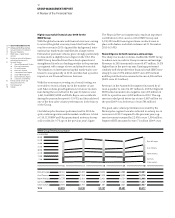
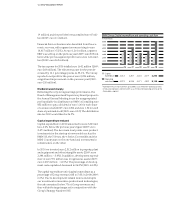
Review of Operations
Sharp rise in car sales volume
The worldwide economic recovery, our strong competi-
tive position in Europe and North America and dynamic
growth in Asia all contributed to the fact that we were
able to record-double-digit growth in car sales volume
in2010; thanks to our attractive model range we sold a
total of 1,461,166 BMW, MINI and Rolls-Royce brand
cars (+13.6%).
Sales of
theBMW brand grew by 14.6%
(1,224,280 units). MINI brand sales totalled 234,175 units
worldwide in
2010 (+ 8.1%) while Rolls-Royce grew
particularly strongly with sales figures more than doubling
to 2,711 units (2009: 1,002 units).
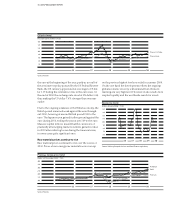
Higher sales volumes in most markets
While sales growth in some of our markets was particu-
larly dynamic in 2010, especially in Latin America and
Asia, sales volume in Europe developed inconsistently,
although up on the previous year. In total, we sold
791,220 BMW, MINI and Rolls-Royce brand cars (+3.9%)
in this region. In Germany, currently the largest single
market for the BMW Group, we sold a total of 267,160
cars in 2010, similar to the previous year’s level. Sales in
Great Britain rose considerably (+12.9%) to 154,750 units
.
The previous year’s sales figures were also exceeded in
France (64,854 units; +2.4%) and Spain (41,289 units;
+1.4%). The only country in which sales were down on
the previous year was Italy (69,161 units; – 8.6%) where
the overall market contracted sharply.
The market for premium cars also recovered in North
America in 2010, where we sold a total of 298,316 cars
during the period under report, 10.1% up on the previous
year. The number of cars handed over to customers in the
USA increased to 266,580 units (+10.1%).
The sales volume recorded in Asia increased dynamically
in 2010 to 286,297 units, outstripping the previous year’s
figure by 56.3%. The Chinese markets (China, Hong Kong,
Taiwan) made a major contribution to this notable per-
formance. The rate of growth on these markets surged by
85.3%, with 183,328 units sold. In Japan, sales were up
by 6.1% to 43,644 units.
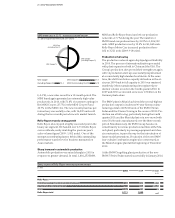
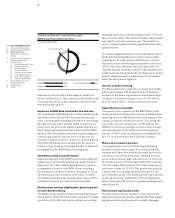
BMW Group – key automobile markets 2010
as a percentage of sales volume
Germany 18.3 Italy 4.7
USA 18.2 France 4.4
China 12.5 Japan 3.0
United Kingdom 10.6 Other 28.3
USA
Germany
China
Italy
Japan
France
United Kingdom
Other
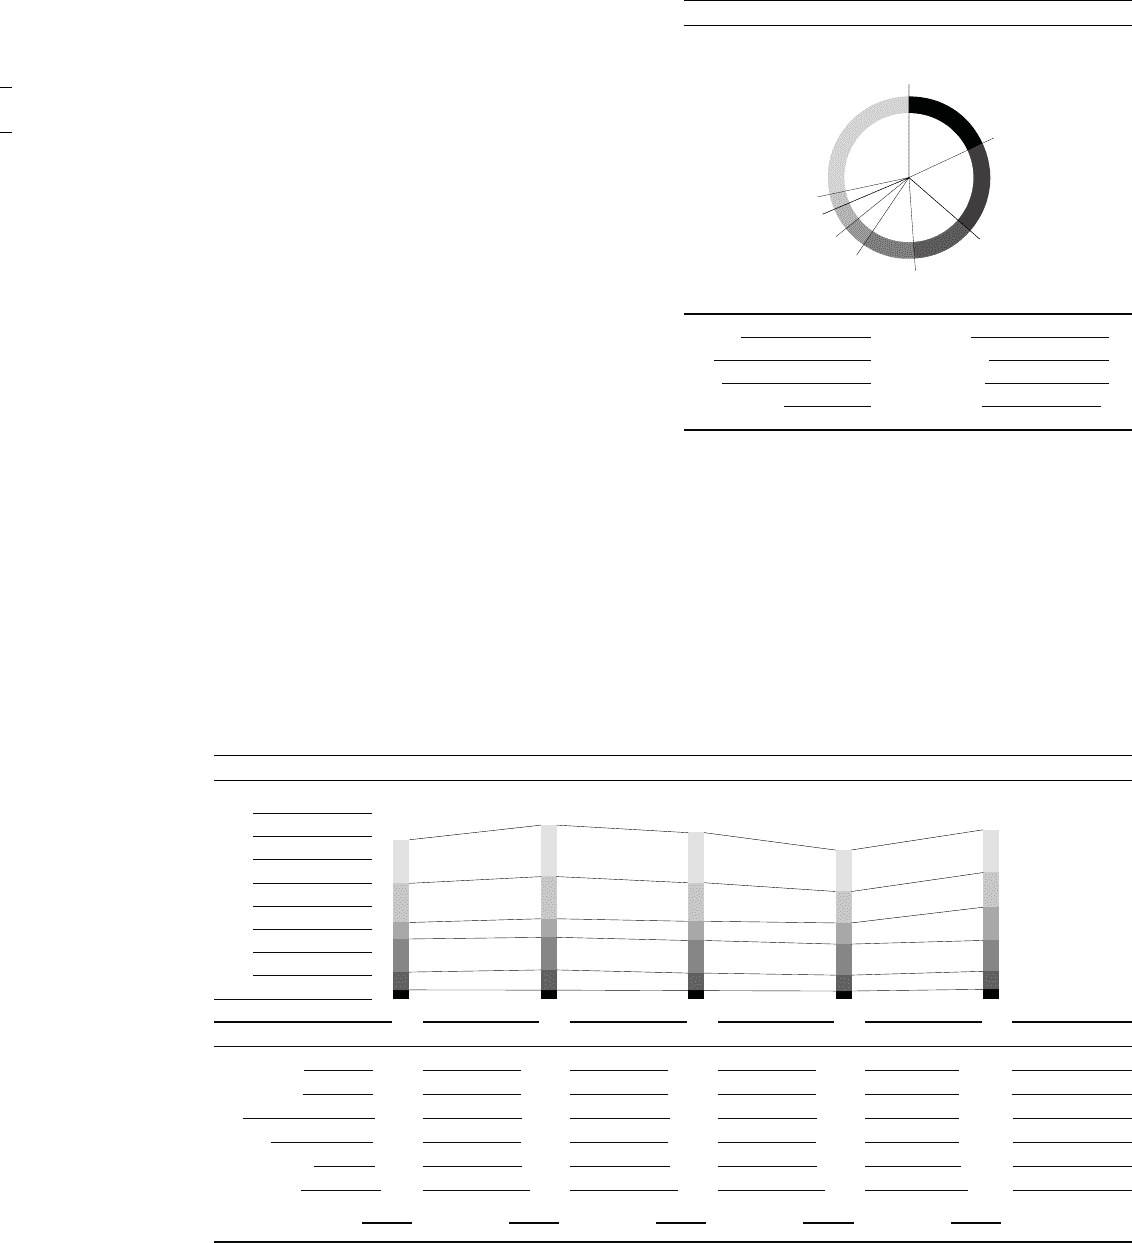
BMW Group Sales volume of vehicles by region and market
in 1,000 units
1,600
1,400
1,200
1,000
800
600
400
200
06 07 08 09 10
Rest of Europe 375.0 443.6 432.2 357.3 369.3
North America 337.4 364.0 331.8 271.0 298.3
Asia 142.2 159.5 165.7 183.1 286.3
Germany 285.3 280.9 280.9 267.5 267.2
United Kingdom 154.1 173.8 151.5 137.1 154.8
Other markets 80.0 78.9 73.8 70.3 85.3
Total 1,374.0 1,500.7 1,435.9 1,286.3 1,461.2
Rest of Europe
North America
Asia
Germany
United Kingdom
Other markets