BMW 2010 Annual Report Download - page 16
Download and view the complete annual report
Please find page 16 of the 2010 BMW annual report below. You can navigate through the pages in the report by either clicking on the pages listed below, or by using the keyword search tool below to find specific information within the annual report.-
 1
1 -
2
-
3
-
4
-
5
-
 6
6 -
 7
7 -
 8
8 -
 9
9 -
 10
10 -
 11
11 -
 12
12 -
 13
13 -
 14
14 -
 15
15 -
 16
16 -
 17
17 -
 18
18 -
 19
19 -
 20
20 -
 21
21 -
 22
22 -
 23
23 -
 24
24 -
 25
25 -
 26
26 -
27
-
28
-
29
-
30
-
31
-
32
-
33
-
34
-
35
-
36
-
37
-
38
-
39
-
40
-
41
-
42
-
43
-
44
-
45
-
46
-
47
-
48
-
49
-
50
-
51
-
52
-
53
-
54
-
55
-
56
-
57
-
58
-
59
-
60
-
61
-
62
-
63
-
64
-
65
-
66
-
67
-
68
-
69
-
70
-
71
-
72
-
73
-
74
-
75
-
76
-
77
-
78
-
79
-
80
-
81
-
82
-
83
-
84
-
85
-
86
-
87
-
88
-
89
-
90
-
91
-
92
-
93
-
94
-
95
-
96
-
97
-
98
-
99
-
100
-
101
-
102
-
103
-
104
-
105
-
106
-
107
-
108
-
109
-
110
-
111
-
112
-
113
-
114
-
115
-
116
-
117
-
118
-
119
-
120
-
121
-
122
-
123
-
124
-
125
-
126
-
127
-
128
-
129
-
130
-
131
-
132
-
133
-
134
-
135
-
136
-
137
-
138
-
139
-
140
-
141
-
142
-
143
-
144
-
145
-
146
-
147
-
148
-
149
-
150
-
151
-
152
-
153
-
154
-
155
-
156
-
157
-
158
-
159
-
160
-
161
-
162
-
163
-
164
-
165
-
166
-
167
-
168
-
169
-
170
-
171
-
172
-
173
-
174
-
175
-
176
-
177
-
178
-
179
-
180
-
181
-
182
-
183
-
184
-
185
-
186
-
187
-
188
-
189
-
190
-
191
-
192
-
193
-
194
-
195
-
196
-
197
-
198
-
199
-
200
-
201
-
202
-
203
-
204
-
205
-
206
-
207
-
208
-
209
-
210
-
211
-
212
-
213
-
214
-
215
-
216
-
217
-
218
-
219
-
220
-
221
-
222
-
223
-
224
-
225
-
226
-
227
-
228
-
229
-
230
-
231
-
232
-
233
-
234
-
235
-
236
-
237
-
238
-
239
-
240
-
241
-
242
-
243
-
244
-
245
-
246
-
247
-
248
-
249
-
250
-
251
-
252
-
253
-
254
-
255
-
256
-
257
-
258
-
259
-
260
-
261
-
262
-
263
-
264
-
265
-
266
-
267
-
268
-
269
-
270
-
271
-
272
-
273
-
274
-
275
-
276
-
277
-
278
-
279
-
280
-
281
-
282
 |
 |

14
12 GROUP MANAGEMENT REPORT
12 A Review of the Financial Year
14 General Economic Environment
18 Review of Operations
41 BMW Group – Capital Market
Activities
44 Disclosures relevant for takeovers
and explanatory comments
47 Financial Analysis
47 Internal Management System
49 Earnings Performance
51 Financial Position
53 Net Assets Position
55 Subsequent Events Report
55 Value Added Statement
57 Key Performance Figures
58 Comments on BMW AG
62 Internal Control System and
explanatory comments
63 Risk Management
70 Outlook
Strong recovery after crisis
The global economy recovered well in 2010 from the
economic collapse caused by the international economic
and financial crisis. The principal factors driving the
up-
swing out of the deepest recession since the Second World
War were massive state-funded stimulus programmes
and the highly expansionary monetary policies pursued
by the world’s major central banks.
The situation was also aided by the fact that most of the
emerging markets in Asia and Latin America had suffered
significantly lower drops in growth than the industrial-
ised countries during the crisis and therefore propped up
the global economy as it swiftly returned to its previous
growth pattern. One of the overall effects of the crisis was
therefore a further shift in economic power towards Asia.
China’s economy grew very strongly again at a rate of
10.3% in 2010. Against this background, many asset prices
continued to rise and there is still a danger of overheating,
particularly on certain regional property markets.
In the USA, the economy recovered from the contraction
experienced in 2009, although by American standards the
upswing was relatively modest at 2.9%. One reason for
this was low consumer spending in the USA, primarily at-
tributable to high unemployment, the faltering property
market and high levels of private debt (albeit falling some-
what).
Markets in the euro zone developed highly diversely in
2010 and the average growth rate was 1.7%. With the ex-
ception of Germany, most major countries were unable
to achieve more than moderate growth. The southern
European countries and Ireland fared poorly after a loss
ofconfidence in their state bonds and the resulting politi-
cal turmoil. While Spain and Ireland stagnated, Greece
was forced to go through yet another year of recession.
Germany was the only country that really took off, record-
ing strong economic growth of 3.6%. The upturn was
largely attributable to improved export figures, but also
assisted by increasingly robust domestic demand driven
by investment expenditure. Although unemployment
dropped to it lowest level for almost 20 years, consumer
spending remained moderate.
The British economy climbed somewhat more slowly out
of recession, with the property market stabilising at a
low level. The sharp rise in unemployment, high levels of
private debt and the resulting weak domestic demand
only allowed a moderate growth rate of 1.7%.
Japan registered very robust growth in 2010, equalling
that of Germany. The economy profited enormously from
the global economic upswing on the one hand (despite
the strong yen), and a return to greater consumer
spending on the other, enabling Japanese gross national
product (GNP) to rise by 4.1%.
Asian and Latin American emerging markets, which had
stood up well during the crisis, were mostly able to
match
or even exceed their long-term growth rates in
2010. India and Brazil, for example, recorded growth
rates of 8.7% and 7.6% respectively. By contrast, most
Eastern European countries grew at significantly lower
rates than in the years prior to the financial crisis. This
was particularly true for Russia with a growth rate of 4.0%.
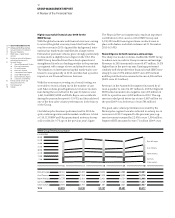
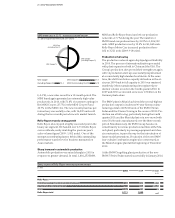
US dollar and yen stronger, British pound remains weak
The value of the US dollar against the euro increased
significantly over the course of the year, with wide fluctu-
ations along the way. After standing at US dollar 1.44 to
General Economic Environment
Exchange rates compared to the Euro
(Index: 30 December 2005 = 100)
140
130
120
110
100
90
80
06 07 08 09 10
Source: Reuters
British Pound
Chinese
Renminbi
Japanese Yen
US Dollar