BMW 2010 Annual Report Download - page 125
Download and view the complete annual report
Please find page 125 of the 2010 BMW annual report below. You can navigate through the pages in the report by either clicking on the pages listed below, or by using the keyword search tool below to find specific information within the annual report.-
 1
1 -
2
-
3
-
4
-
5
-
6
-
7
-
8
-
9
-
10
-
11
-
12
-
13
-
14
-
15
-
16
-
17
-
18
-
19
-
20
-
21
-
22
-
23
-
24
-
25
-
26
-
27
-
28
-
29
-
30
-
31
-
32
-
33
-
34
-
35
-
36
-
37
-
38
-
39
-
40
-
41
-
42
-
43
-
44
-
45
-
46
-
47
-
48
-
49
-
50
-
51
-
52
-
53
-
54
-
55
-
56
-
57
-
58
-
59
-
60
-
61
-
62
-
63
-
64
-
65
-
66
-
67
-
68
-
69
-
70
-
71
-
72
-
73
-
74
-
75
-
76
-
77
-
78
-
79
-
80
-
81
-
82
-
83
-
84
-
85
-
86
-
87
-
88
-
89
-
90
-
91
-
92
-
93
-
94
-
95
-
96
-
97
-
98
-
99
-
100
-
101
-
102
-
103
-
104
-
105
-
106
-
107
-
108
-
109
-
110
-
111
-
112
-
113
-
114
-
 115
115 -
 116
116 -
 117
117 -
 118
118 -
 119
119 -
 120
120 -
 121
121 -
 122
122 -
 123
123 -
 124
124 -
 125
125 -
 126
126 -
 127
127 -
 128
128 -
 129
129 -
 130
130 -
 131
131 -
 132
132 -
 133
133 -
 134
134 -
 135
135 -
136
-
137
-
138
-
139
-
140
-
141
-
142
-
143
-
144
-
145
-
146
-
147
-
148
-
149
-
150
-
151
-
152
-
153
-
154
-
155
-
156
-
157
-
158
-
159
-
160
-
161
-
162
-
163
-
164
-
165
-
166
-
167
-
168
-
169
-
170
-
171
-
172
-
173
-
174
-
175
-
176
-
177
-
178
-
179
-
180
-
181
-
182
-
183
-
184
-
185
-
186
-
187
-
188
-
189
-
190
-
191
-
192
-
193
-
194
-
195
-
196
-
197
-
198
-
199
-
200
-
201
-
202
-
203
-
204
-
205
-
206
-
207
-
208
-
209
-
210
-
211
-
212
-
213
-
214
-
215
-
216
-
217
-
218
-
219
-
220
-
221
-
222
-
223
-
224
-
225
-
226
-
227
-
228
-
229
-
230
-
231
-
232
-
233
-
234
-
235
-
236
-
237
-
238
-
239
-
240
-
241
-
242
-
243
-
244
-
245
-
246
-
247
-
248
-
249
-
250
-
251
-
252
-
253
-
254
-
255
-
256
-
257
-
258
-
259
-
260
-
261
-
262
-
263
-
264
-
265
-
266
-
267
-
268
-
269
-
270
-
271
-
272
-
273
-
274
-
275
-
276
-
277
-
278
-
279
-
280
-
281
-
282
 |
 |

123 GROUP FINANCIAL STATEMENTS
in euro million 2010 2009
Held for trading
Gains / losses from the use of derivative instruments 15 338
Available-for-sale
Gains and losses on sale and fair value measurement of marketable securities held for sale
(including investments in subsidiaries and participations measured at cost) –175 – 23
Income from investments 5 4
Accumulated other equity
Balance at 1 January 20 17
Total change during the year –11 3
of which recognised in the income statement during the period under report 3 – 7
Balance at 31 December 9 20
Loans and receivables
Impairment losses / reversals of impairment losses – 581 – 801
Other income / expenses – 69 – 49
Other liabilities
Income / expenses – 90 –113
in euro million 2010 2009
Balance at 1 January 209 45
Total changes during the year – 336 164
of which recognised in the income statement during the period under report 274 – 63
Balance at 31 December –127 209
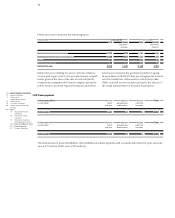
Other investments (available-for-sale) amounting to euro
177 million (2009: euro 232 million) are measured at
amortised cost since quoted market prices are not
avail-
able or cannot be determined reliably. These are therefore
not included in the level hierarchy shown above.
As in the previous year, there were no significant reclassi-
fications within the level hierarchy during the financial
year 2010.
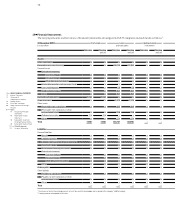
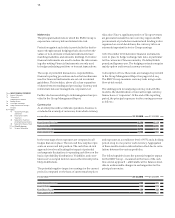
Gains and losses on financial instruments
The following table shows the net gains and losses arising
for each of the categories of financial instrument defined
by IAS 39:
Gains / losses from the use of derivatives relate primarily
to fair value gains or losses arising on stand-alone deriva-
tives.
Interest income and expense from interest rate and inter-
est rate /currency swaps amounted to a net expense of
euro 178 million (2009: net expense of euro 294 million).
Write-downs of euro 3 million (2009: euro 3 million) on
available-for-sale securities, for which fair value changes
were previously recognised directly in equity, were rec-
ognised as expense in 2010. As in the previous year, there
were no reversals of write-downs on current marketable
securities recognised directly in equity.
The disclosure of interest income resulting from the un-
winding of interest on future expected receipts would
normally only be relevant for the BMW Group where as-
sets have been discounted as part of the process of deter-
mining impairment losses. However, as a result of the as-
sumption that most of the income that is subsequently
recovered is received within one year and the fact that
the impact is not material, the BMW Group does not dis-
count assets for the purposes of determining impairment
losses.
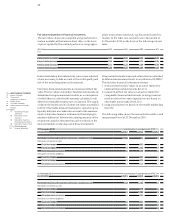
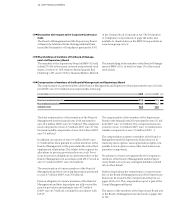
Cash flow hedges
The effect of cash flow hedges on accumulated other equity
was as follows:
During the period under report, an expense of euro 24 mil-
lion
(2009: euro 44 million) was recognised in the in-
come statement to reflect forecasting errors and conse-
quent over-hedging of currency exposures. In addition,
the ineffective portion of cash flow hedges relating to
raw materials expensed in the income statement amounted
to euro 3 million (2009: –).
At 31 December 2010 the BMW Group held derivative
instruments with terms of up to 60 months (2009: