BMW 2010 Annual Report Download - page 80
Download and view the complete annual report
Please find page 80 of the 2010 BMW annual report below. You can navigate through the pages in the report by either clicking on the pages listed below, or by using the keyword search tool below to find specific information within the annual report.-
 1
1 -
2
-
3
-
4
-
5
-
6
-
7
-
8
-
9
-
10
-
11
-
12
-
13
-
14
-
15
-
16
-
17
-
18
-
19
-
20
-
21
-
22
-
23
-
24
-
25
-
26
-
27
-
28
-
29
-
30
-
31
-
32
-
33
-
34
-
35
-
36
-
37
-
38
-
39
-
40
-
41
-
42
-
43
-
44
-
45
-
46
-
47
-
48
-
49
-
50
-
51
-
52
-
53
-
54
-
55
-
56
-
57
-
58
-
59
-
60
-
61
-
62
-
63
-
64
-
65
-
66
-
67
-
68
-
69
-
 70
70 -
 71
71 -
 72
72 -
 73
73 -
 74
74 -
 75
75 -
 76
76 -
 77
77 -
 78
78 -
 79
79 -
 80
80 -
 81
81 -
 82
82 -
 83
83 -
 84
84 -
 85
85 -
 86
86 -
 87
87 -
 88
88 -
 89
89 -
 90
90 -
91
-
92
-
93
-
94
-
95
-
96
-
97
-
98
-
99
-
100
-
101
-
102
-
103
-
104
-
105
-
106
-
107
-
108
-
109
-
110
-
111
-
112
-
113
-
114
-
115
-
116
-
117
-
118
-
119
-
120
-
121
-
122
-
123
-
124
-
125
-
126
-
127
-
128
-
129
-
130
-
131
-
132
-
133
-
134
-
135
-
136
-
137
-
138
-
139
-
140
-
141
-
142
-
143
-
144
-
145
-
146
-
147
-
148
-
149
-
150
-
151
-
152
-
153
-
154
-
155
-
156
-
157
-
158
-
159
-
160
-
161
-
162
-
163
-
164
-
165
-
166
-
167
-
168
-
169
-
170
-
171
-
172
-
173
-
174
-
175
-
176
-
177
-
178
-
179
-
180
-
181
-
182
-
183
-
184
-
185
-
186
-
187
-
188
-
189
-
190
-
191
-
192
-
193
-
194
-
195
-
196
-
197
-
198
-
199
-
200
-
201
-
202
-
203
-
204
-
205
-
206
-
207
-
208
-
209
-
210
-
211
-
212
-
213
-
214
-
215
-
216
-
217
-
218
-
219
-
220
-
221
-
222
-
223
-
224
-
225
-
226
-
227
-
228
-
229
-
230
-
231
-
232
-
233
-
234
-
235
-
236
-
237
-
238
-
239
-
240
-
241
-
242
-
243
-
244
-
245
-
246
-
247
-
248
-
249
-
250
-
251
-
252
-
253
-
254
-
255
-
256
-
257
-
258
-
259
-
260
-
261
-
262
-
263
-
264
-
265
-
266
-
267
-
268
-
269
-
270
-
271
-
272
-
273
-
274
-
275
-
276
-
277
-
278
-
279
-
280
-
281
-
282
 |
 |

78
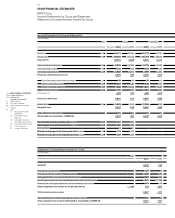
74 GROUP FINANCIAL STATEMENTS
74 Income Statements
74 Statement of
Comprehensive Income
76 Balance Sheets
78 Cash Flow Statements
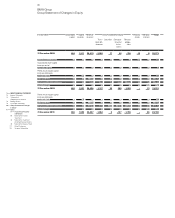
80 Group Statement of Changes
in Equity
81 Notes
81 Accounting Principles
and Policies
89 Notes to the Income
Statement
95 Notes to the Statement
of Comprehensive Income
96 Notes to the Balance Sheet
117 Other Disclosures
133 Segment Information
Note Group
in euro million 2010 20091
Net profit / loss 3,234 210
Reconciliation between net profit / loss and cash inflow from operating activities
Current tax 1,430 338
Other interest and similar income / expenses 422 –1132
Depreciation of leased products 5,381 5,476
Depreciation and amortisation of other tangible, intangible and investment assets 3,861 3,603
Change in provisions 911 1
Change in deferred taxes 340 – 95
Other non-cash income and expense items – 454 17
Gain / loss on disposal of tangible, intangible and investment assets 5 – 35
Result from equity accounted investments – 98 – 36
Changes in working capital – 403 1,802
Change in inventories – 1,170 855
Change in trade receivables – 427 506
Change in trade payables 1,194 441
Change in other operating assets and liabilities 572 – 894
Income taxes paid – 1,318 – 349
Interest received 1482 3462
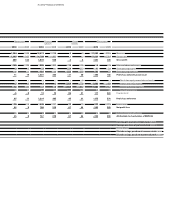
Cash inflow from operating activities 39 13,651 10,271
Investment in intangible assets and property, plant and equipment – 3,263 – 3,471
Proceeds from the disposal of intangible assets and property, plant and equipment 55 169
Expenditure for investments – 80 – 53
Proceeds from the disposal of investments 23 15
Investment in leased products – 11,898 –10,433
Disposals of leased products 7,422 6,515
Additions to receivables from sales financing – 61,120 – 49,629
Payments received on receivables from sales financing 56,264 47,847
Cash payments for the purchase of marketable securities – 2,723 – 2,908
Cash proceeds from the sale of marketable securities 798 620
Cash outflow from investing activities 39 – 14,522 –11,328
Issue of treasury shares – 6
Payments into equity 18 7
Payment of dividend for the previous year – 197 –197
Interest paid – 2232 – 2242
Proceeds from the issue of bonds 4,578 9,762
Repayment of bonds – 3,406 – 6,440
Internal financing – –
Change in other financial liabilities – 292 –1,307
Change in commercial paper 32 – 255
Cash inflow / outflow from financing activities 39 510 1,352
Effect of exchange rate and changes in composition of Group on cash and cash equivalents 39 26 18
Change in cash and cash equivalents – 335 313
Cash and cash equivalents as at 1 January 7,767 7,454
Cash and cash equivalents as at 31 December 39 7,432 7,767
1 Previous year’s figures adjusted as a result of a change in presentation of other operating assets and liabilities
2 Interest relating to financial services business is classified as revenues / cost of sales.
BMW Group
Cash Flow Statements for Group and Segments