BMW 2010 Annual Report Download - page 102
Download and view the complete annual report
Please find page 102 of the 2010 BMW annual report below. You can navigate through the pages in the report by either clicking on the pages listed below, or by using the keyword search tool below to find specific information within the annual report.-
 1
1 -
2
-
3
-
4
-
5
-
6
-
7
-
8
-
9
-
10
-
11
-
12
-
13
-
14
-
15
-
16
-
17
-
18
-
19
-
20
-
21
-
22
-
23
-
24
-
25
-
26
-
27
-
28
-
29
-
30
-
31
-
32
-
33
-
34
-
35
-
36
-
37
-
38
-
39
-
40
-
41
-
42
-
43
-
44
-
45
-
46
-
47
-
48
-
49
-
50
-
51
-
52
-
53
-
54
-
55
-
56
-
57
-
58
-
59
-
60
-
61
-
62
-
63
-
64
-
65
-
66
-
67
-
68
-
69
-
70
-
71
-
72
-
73
-
74
-
75
-
76
-
77
-
78
-
79
-
80
-
81
-
82
-
83
-
84
-
85
-
86
-
87
-
88
-
89
-
90
-
91
-
 92
92 -
 93
93 -
 94
94 -
 95
95 -
 96
96 -
 97
97 -
 98
98 -
 99
99 -
 100
100 -
 101
101 -
 102
102 -
 103
103 -
 104
104 -
 105
105 -
 106
106 -
 107
107 -
 108
108 -
 109
109 -
 110
110 -
 111
111 -
 112
112 -
113
-
114
-
115
-
116
-
117
-
118
-
119
-
120
-
121
-
122
-
123
-
124
-
125
-
126
-
127
-
128
-
129
-
130
-
131
-
132
-
133
-
134
-
135
-
136
-
137
-
138
-
139
-
140
-
141
-
142
-
143
-
144
-
145
-
146
-
147
-
148
-
149
-
150
-
151
-
152
-
153
-
154
-
155
-
156
-
157
-
158
-
159
-
160
-
161
-
162
-
163
-
164
-
165
-
166
-
167
-
168
-
169
-
170
-
171
-
172
-
173
-
174
-
175
-
176
-
177
-
178
-
179
-
180
-
181
-
182
-
183
-
184
-
185
-
186
-
187
-
188
-
189
-
190
-
191
-
192
-
193
-
194
-
195
-
196
-
197
-
198
-
199
-
200
-
201
-
202
-
203
-
204
-
205
-
206
-
207
-
208
-
209
-
210
-
211
-
212
-
213
-
214
-
215
-
216
-
217
-
218
-
219
-
220
-
221
-
222
-
223
-
224
-
225
-
226
-
227
-
228
-
229
-
230
-
231
-
232
-
233
-
234
-
235
-
236
-
237
-
238
-
239
-
240
-
241
-
242
-
243
-
244
-
245
-
246
-
247
-
248
-
249
-
250
-
251
-
252
-
253
-
254
-
255
-
256
-
257
-
258
-
259
-
260
-
261
-
262
-
263
-
264
-
265
-
266
-
267
-
268
-
269
-
270
-
271
-
272
-
273
-
274
-
275
-
276
-
277
-
278
-
279
-
280
-
281
-
282
 |
 |

100
74 GROUP FINANCIAL STATEMENTS
74 Income Statements
74 Statement of
Comprehensive Income
76 Balance Sheets
78 Cash Flow Statements
80 Group Statement of Changes
in Equity
81 Notes
81 Accounting Principles
and Policies
89 Notes to the Income
Statement
95 Notes to the Statement
of Comprehensive Income
96 Notes to the Balance Sheet
117 Other Disclosures
133 Segment Information
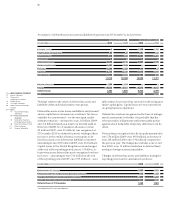
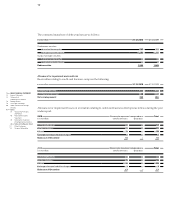
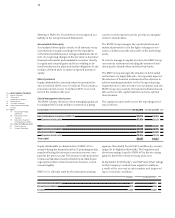
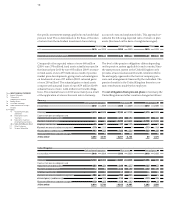
in euro million 31. 12. 2010 31. 12. 2009
Gross investment in finance leases
due within one year 3,922 3,477
due between one and five years 7,185 6,269
due later than five years 56 28
11,163 9,774
Present value of future minimum lease payments
due within one year 3,409 3,056
due between one and five years 6,446 5,542
due later than five years 50 25
9,905 8,623
Unrealised interest income 1,258 1,151
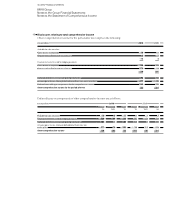
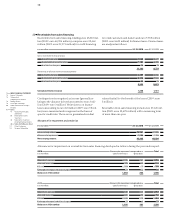
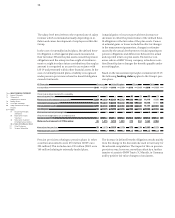
in euro million 31. 12. 2010 31. 12. 2009
Gross carrying amount 46,961 41,950
Allowance for impairment –1,596 –1,356
Net carrying amount 45,365 40,594
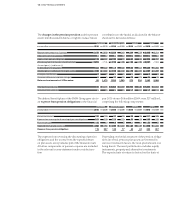
2010 Allowance for impairment recognised on a Total
in euro million specific item basis group basis
Balance at 1 January 1,195 161 1,356
Allocated / reversed 489 45 534
Utilised – 365 –15 – 380
Exchange rate impact and other changes 74 12 86
Balance at 31 December 1,393 203 1,596
2009 Allowance for impairment recognised on a Total
in euro million specific item basis group basis
Balance at 1 January 938 115 1,053
Allocated / reversed 682 50 732
Utilised – 444 –10 – 454
Exchange rate impact and other changes 19 6 25
Balance at 31 December 1,195 161 1,356
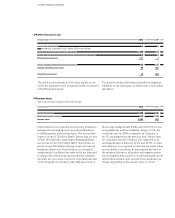
23
Receivables from sales financing
Receivables from sales financing, totalling euro 45,365 mil-
lion
(2009: euro 40,594 million), comprise euro 35,460
million (2009: euro 31,971 million) for credit financing
for retail customers and dealers and euro 9,905 million
(2009: euro 8,623 million) for finance leases. Finance leases
are analysed as follows:
Contingent rents recognised as income (generally re-
lating to the distance driven) amounted to euro 3 mil-
lion
(2009: euro 3 million). Write-downs on finance
leases amounting to euro 68 million (2009: euro 58 mil-
lion) were measured and recognised on the basis of
specific credit risks. There are no guaranteed residual
values that fall to the benefit of the lessor (2009: euro
3million).
Receivables from sales financing include euro 27,126 mil-
lion (2009: euro 23,478 million) with a remaining term
of more than one year.
Allowance for impairment and credit risk
Allowances for impairment on receivables from sales financing developed as follows during the year under report: