BMW 2010 Annual Report Download - page 112
Download and view the complete annual report
Please find page 112 of the 2010 BMW annual report below. You can navigate through the pages in the report by either clicking on the pages listed below, or by using the keyword search tool below to find specific information within the annual report.-
 1
1 -
2
-
3
-
4
-
5
-
6
-
7
-
8
-
9
-
10
-
11
-
12
-
13
-
14
-
15
-
16
-
17
-
18
-
19
-
20
-
21
-
22
-
23
-
24
-
25
-
26
-
27
-
28
-
29
-
30
-
31
-
32
-
33
-
34
-
35
-
36
-
37
-
38
-
39
-
40
-
41
-
42
-
43
-
44
-
45
-
46
-
47
-
48
-
49
-
50
-
51
-
52
-
53
-
54
-
55
-
56
-
57
-
58
-
59
-
60
-
61
-
62
-
63
-
64
-
65
-
66
-
67
-
68
-
69
-
70
-
71
-
72
-
73
-
74
-
75
-
76
-
77
-
78
-
79
-
80
-
81
-
82
-
83
-
84
-
85
-
86
-
87
-
88
-
89
-
90
-
91
-
92
-
93
-
94
-
95
-
96
-
97
-
98
-
99
-
100
-
101
-
 102
102 -
 103
103 -
 104
104 -
 105
105 -
 106
106 -
 107
107 -
 108
108 -
 109
109 -
 110
110 -
 111
111 -
 112
112 -
 113
113 -
 114
114 -
 115
115 -
 116
116 -
 117
117 -
 118
118 -
 119
119 -
 120
120 -
 121
121 -
 122
122 -
123
-
124
-
125
-
126
-
127
-
128
-
129
-
130
-
131
-
132
-
133
-
134
-
135
-
136
-
137
-
138
-
139
-
140
-
141
-
142
-
143
-
144
-
145
-
146
-
147
-
148
-
149
-
150
-
151
-
152
-
153
-
154
-
155
-
156
-
157
-
158
-
159
-
160
-
161
-
162
-
163
-
164
-
165
-
166
-
167
-
168
-
169
-
170
-
171
-
172
-
173
-
174
-
175
-
176
-
177
-
178
-
179
-
180
-
181
-
182
-
183
-
184
-
185
-
186
-
187
-
188
-
189
-
190
-
191
-
192
-
193
-
194
-
195
-
196
-
197
-
198
-
199
-
200
-
201
-
202
-
203
-
204
-
205
-
206
-
207
-
208
-
209
-
210
-
211
-
212
-
213
-
214
-
215
-
216
-
217
-
218
-
219
-
220
-
221
-
222
-
223
-
224
-
225
-
226
-
227
-
228
-
229
-
230
-
231
-
232
-
233
-
234
-
235
-
236
-
237
-
238
-
239
-
240
-
241
-
242
-
243
-
244
-
245
-
246
-
247
-
248
-
249
-
250
-
251
-
252
-
253
-
254
-
255
-
256
-
257
-
258
-
259
-
260
-
261
-
262
-
263
-
264
-
265
-
266
-
267
-
268
-
269
-
270
-
271
-
272
-
273
-
274
-
275
-
276
-
277
-
278
-
279
-
280
-
281
-
282
 |
 |

110
74 GROUP FINANCIAL STATEMENTS
74 Income Statements
74 Statement of
Comprehensive Income
76 Balance Sheets
78 Cash Flow Statements
80 Group Statement of Changes
in Equity
81 Notes
81 Accounting Principles
and Policies
89 Notes to the Income
Statement
95 Notes to the Statement
of Comprehensive Income
96 Notes to the Balance Sheet
117 Other Disclosures
133 Segment Information
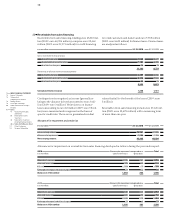
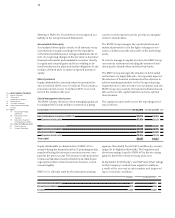
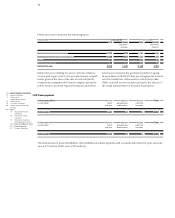
Germany United Kingdom Other
in % 2010 2009 2010 2009 2010 2009
Expected rate of return on plan assets 5.30 6.12 5.40 6.03 5.51 6.55
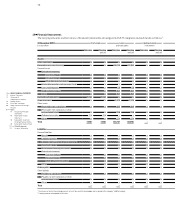
Germany
Defined benefit obligation Plan assets Net obligation
in euro million 2010 2009 2010 2009 2010 2009
1 January 4,619 3,848 – 3,144 –1,155 1,475 2,693
Expense from pension obligations and
expected return on plan assets 321 331 – 202 – 94 119 237
Payments to external funds – – –1,740 –1,642 –1,740 –1,642
Employee contributions 29 27 – 27 – 25 2 2
Payments on account and pension payments –119 –111 8 7 –111 –104
Actuarial gains (–) and losses (+) 441 522 –102 – 234 339 288
Translation differences and other changes 1 2 – –1 1 1
31 December 5,292 4,619 – 5,207 – 3,144 85 1,475
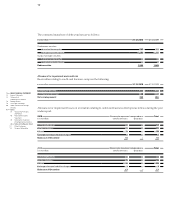
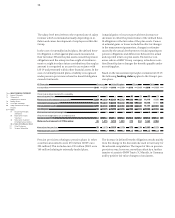
United Kingdom
Defined benefit obligation Plan assets Net obligation
in euro million 2010 2009 2010 2009 2010 2009
1 January 5,743 4,403 – 4,487 – 4,059 1,256 344
Expense from pension obligations and
expected return on plan assets 381 334 – 246 – 257 135 77
Payments to external funds – – –112 – 99 –112 – 99
Employee contributions 1 1 –1 –1 – –
Payments on account and pension payments – 282 – 264 282 264 – –
Actuarial gains (–) and losses (+) – 7 946 –110 – 40 –117 906
Translation differences and other changes 178 323 –138 – 295 40 28
31 December 6,014 5,743 – 4,812 – 4,487 1,202 1,256
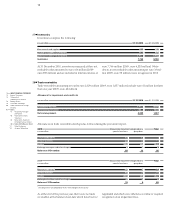
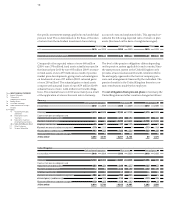
Compared to the expected return of euro 468 million
(2009: euro 370 million), fund assets actually increased in
the financial year 2010 by euro 695 million (2009: increase
in fund assets of euro 659 million) as a result of positive
market price developments, giving rise to actuarial gains
on fund assets of euro 227 million (2009: actuarial gains
of euro 289 million). The actuarial gains on fund assets
compare with actuarial losses of euro 459 million (2009:
actuarial losses of euro 1,464 million) on benefit obliga-
tions. The actuarial losses in 2010 arose mainly as a result
of the application of a lower discount rate in Germany.
thespecific investment strategy applied to each individual
pension fund. This is determined on the basis of the rates
of return from the individual investment classes taking
account of costs and unplanned risks. This approach re-
sulted in the following expected rates of return on plan
assets (disclosed on the basis of weighted averages):
The level of the pension obligations differs depending
onthe pension system applicable in each country. Since
the state pension system in the United Kingdom only
provides a basic fixed amount benefit, retirement bene-
fits are largely organised in the form of company pen-
sions and arrangements financed by the individual. The
pension benefits in the United Kingdom therefore con-
tain contributions made by the employee.
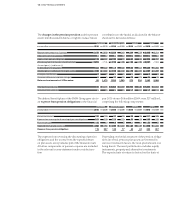
The net obligation from pension plans in Germany, the
United Kingdom and other countries changed as follows: