BMW 2010 Annual Report Download - page 81
Download and view the complete annual report
Please find page 81 of the 2010 BMW annual report below. You can navigate through the pages in the report by either clicking on the pages listed below, or by using the keyword search tool below to find specific information within the annual report.-
 1
1 -
2
-
3
-
4
-
5
-
6
-
7
-
8
-
9
-
10
-
11
-
12
-
13
-
14
-
15
-
16
-
17
-
18
-
19
-
20
-
21
-
22
-
23
-
24
-
25
-
26
-
27
-
28
-
29
-
30
-
31
-
32
-
33
-
34
-
35
-
36
-
37
-
38
-
39
-
40
-
41
-
42
-
43
-
44
-
45
-
46
-
47
-
48
-
49
-
50
-
51
-
52
-
53
-
54
-
55
-
56
-
57
-
58
-
59
-
60
-
61
-
62
-
63
-
64
-
65
-
66
-
67
-
68
-
69
-
70
-
 71
71 -
 72
72 -
 73
73 -
 74
74 -
 75
75 -
 76
76 -
 77
77 -
 78
78 -
 79
79 -
 80
80 -
 81
81 -
 82
82 -
 83
83 -
 84
84 -
 85
85 -
 86
86 -
 87
87 -
 88
88 -
 89
89 -
 90
90 -
 91
91 -
92
-
93
-
94
-
95
-
96
-
97
-
98
-
99
-
100
-
101
-
102
-
103
-
104
-
105
-
106
-
107
-
108
-
109
-
110
-
111
-
112
-
113
-
114
-
115
-
116
-
117
-
118
-
119
-
120
-
121
-
122
-
123
-
124
-
125
-
126
-
127
-
128
-
129
-
130
-
131
-
132
-
133
-
134
-
135
-
136
-
137
-
138
-
139
-
140
-
141
-
142
-
143
-
144
-
145
-
146
-
147
-
148
-
149
-
150
-
151
-
152
-
153
-
154
-
155
-
156
-
157
-
158
-
159
-
160
-
161
-
162
-
163
-
164
-
165
-
166
-
167
-
168
-
169
-
170
-
171
-
172
-
173
-
174
-
175
-
176
-
177
-
178
-
179
-
180
-
181
-
182
-
183
-
184
-
185
-
186
-
187
-
188
-
189
-
190
-
191
-
192
-
193
-
194
-
195
-
196
-
197
-
198
-
199
-
200
-
201
-
202
-
203
-
204
-
205
-
206
-
207
-
208
-
209
-
210
-
211
-
212
-
213
-
214
-
215
-
216
-
217
-
218
-
219
-
220
-
221
-
222
-
223
-
224
-
225
-
226
-
227
-
228
-
229
-
230
-
231
-
232
-
233
-
234
-
235
-
236
-
237
-
238
-
239
-
240
-
241
-
242
-
243
-
244
-
245
-
246
-
247
-
248
-
249
-
250
-
251
-
252
-
253
-
254
-
255
-
256
-
257
-
258
-
259
-
260
-
261
-
262
-
263
-
264
-
265
-
266
-
267
-
268
-
269
-
270
-
271
-
272
-
273
-
274
-
275
-
276
-
277
-
278
-
279
-
280
-
281
-
282
 |
 |

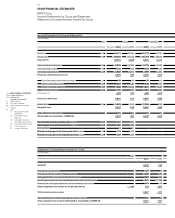
79 GROUP FINANCIAL STATEMENTS
Automobiles Financial Services
2010 20091 2010 20091
2,607 – 439 768 218 Net profit / loss
Reconciliation between net profit / loss and cash inflow from operating activities
1,145 251 277 152 Current tax
150 255 22 42 Other interest and similar income / expenses
6 7 4,823 5,732 Depreciation of leased products
3,762 3,502 22 25 Depreciation and amortisation of other tangible, intangible and investment assets
869 42 – 49 93 Change in provisions
27 – 448 440 69 Change in deferred taxes
116 –170 – 408 307 Other non-cash income and expense items
4 – 29 1 1 Gain / loss on disposal of tangible, intangible and investment assets
– 98 – 43 – – Result from equity accounted investments
– 374 1.806 5 6 Changes in working capital
– 1,163 871 1 – Change in inventories
– 364 513 – 43 – Change in trade receivables
1,153 422 47 6 Change in trade payables
999 214 – 176 309 Change in other operating assets and liabilities
– 1,199 – 369 – 147 – 99 Income taxes paid
136 342 –
2 –
2 Interest received
8,150 4,921 5,558 6,817 Cash inflow from operating activities
– 3,183 – 3,409 – 10 –10 Investment in intangible assets and property, plant and equipment
59 98 1 2 Proceeds from the disposal of intangible assets and property, plant and equipment
– 577 – 261 – – Expenditure for investments
23 33 – – Proceeds from the disposal of investments
– 172 –197 – 11,726 –10,236 Investment in leased products
171 271 7,251 6,215 Disposals of leased products
– – – 61,120 – 49,629 Additions to receivables from sales financing
– – 56,264 47,847 Payments received on receivables from sales financing
– 2,620 – 2,787 – 103 –121 Cash payments for the purchase of marketable securities
757 577 41 43 Cash proceeds from the sale of marketable securities
– 5,542 – 5,675 – 9,402 – 5,889 Cash outflow from investing activities
– 6 – – Issue of treasury shares
18 7 – – Payments into equity
– 197 –197 – – Payment of dividend for the previous year
– 212 – 76 –
2 –
2 Interest paid
– – 2,361 658 Proceeds from the issue of bonds
– 52 – – 364 –1,230 Repayment of bonds
2,703 180 204 722 Internal financing
– 2,117 – 874 68 – 351 Change in other financial liabilities
– 1,519 964 – – Change in commercial paper
– 1,376 10 2,269 – 201 Cash inflow / outflow from financing activities
22 2 – 1 23 Effect of exchange rate and changes in composition of Group on cash and cash equivalents
1,254 – 742 – 1,576 750 Change in cash and cash equivalents
4,331 5,073 2,803 2,053 Cash and cash equivalents as at 1 January
5,585 4,331 1,227 2,803 Cash and cash equivalents as at 31 December