BMW 2010 Annual Report Download - page 51
Download and view the complete annual report
Please find page 51 of the 2010 BMW annual report below. You can navigate through the pages in the report by either clicking on the pages listed below, or by using the keyword search tool below to find specific information within the annual report.-
 1
1 -
2
-
3
-
4
-
5
-
6
-
7
-
8
-
9
-
10
-
11
-
12
-
13
-
14
-
15
-
16
-
17
-
18
-
19
-
20
-
21
-
22
-
23
-
24
-
25
-
26
-
27
-
28
-
29
-
30
-
31
-
32
-
33
-
34
-
35
-
36
-
37
-
38
-
39
-
40
-
 41
41 -
 42
42 -
 43
43 -
 44
44 -
 45
45 -
 46
46 -
 47
47 -
 48
48 -
 49
49 -
 50
50 -
 51
51 -
 52
52 -
 53
53 -
 54
54 -
 55
55 -
 56
56 -
 57
57 -
 58
58 -
 59
59 -
 60
60 -
 61
61 -
62
-
63
-
64
-
65
-
66
-
67
-
68
-
69
-
70
-
71
-
72
-
73
-
74
-
75
-
76
-
77
-
78
-
79
-
80
-
81
-
82
-
83
-
84
-
85
-
86
-
87
-
88
-
89
-
90
-
91
-
92
-
93
-
94
-
95
-
96
-
97
-
98
-
99
-
100
-
101
-
102
-
103
-
104
-
105
-
106
-
107
-
108
-
109
-
110
-
111
-
112
-
113
-
114
-
115
-
116
-
117
-
118
-
119
-
120
-
121
-
122
-
123
-
124
-
125
-
126
-
127
-
128
-
129
-
130
-
131
-
132
-
133
-
134
-
135
-
136
-
137
-
138
-
139
-
140
-
141
-
142
-
143
-
144
-
145
-
146
-
147
-
148
-
149
-
150
-
151
-
152
-
153
-
154
-
155
-
156
-
157
-
158
-
159
-
160
-
161
-
162
-
163
-
164
-
165
-
166
-
167
-
168
-
169
-
170
-
171
-
172
-
173
-
174
-
175
-
176
-
177
-
178
-
179
-
180
-
181
-
182
-
183
-
184
-
185
-
186
-
187
-
188
-
189
-
190
-
191
-
192
-
193
-
194
-
195
-
196
-
197
-
198
-
199
-
200
-
201
-
202
-
203
-
204
-
205
-
206
-
207
-
208
-
209
-
210
-
211
-
212
-
213
-
214
-
215
-
216
-
217
-
218
-
219
-
220
-
221
-
222
-
223
-
224
-
225
-
226
-
227
-
228
-
229
-
230
-
231
-
232
-
233
-
234
-
235
-
236
-
237
-
238
-
239
-
240
-
241
-
242
-
243
-
244
-
245
-
246
-
247
-
248
-
249
-
250
-
251
-
252
-
253
-
254
-
255
-
256
-
257
-
258
-
259
-
260
-
261
-
262
-
263
-
264
-
265
-
266
-
267
-
268
-
269
-
270
-
271
-
272
-
273
-
274
-
275
-
276
-
277
-
278
-
279
-
280
-
281
-
282
 |
 |

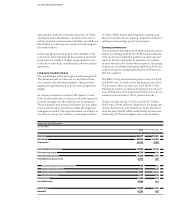
49 GROUP MANAGEMENT REPORT
Group Income Statement
in euro million
2010 2009
Revenues 60,477 50,681
Cost of sales – 49,562 – 45,356
Gross profit 10,915 5,325
Sales and administrative costs – 5,529 – 5,040
Other operating income 766 808
Other operating expenses –1,058 – 804
Profit before financial result 5,094 289
Result from equity accounted investments 98 36
Interest and similar income 685 856
Interest and similar expenses – 966 –1,014
Other financial result – 75 246
Financial result – 258 124
Profit before tax 4,836 413
Income taxes – 1,602 – 203
Net profit 3,234 210
opportunities and risks. Internal project rates of return
and capital values (model rates of return in the case of
vehicle projects) are measured on the basis of cash flows.
Model rates of return are also compared with competi-
tive market values.
In this way, the amount a project will contribute to the
total value of the segment can be measured when the
project decision is taken. Targets and performance are
controlled on the basis of individual cash-flow-related
parameters.
Long-term creation of value
The overall target set for earnings is continuous growth.
The minimum rate of return set for each line of busi-
ness
is used as the relevant
parameter. These periodic
targets are supplementary to project and programme
targets.
For all project decisions reached, the impact of cash
flows
on the model rate of return as well as the impact on
periodic earnings over the long term are documented.
The fact that the performance indicators are also taken
into account ensures consistency within the target and
management model. This approach allows an analysis of
the effect of each project decision on earnings and rates
of return. Multi-project planning data resulting from
these procedures allows ongoing comparison between
multi-period and single-period performance.
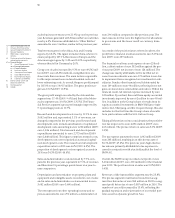
Earnings performance
The recovery on international car markets had a positive
impact on earnings in 2010. The BMW Group benefited
from its strong competitive position on international
markets, driven in particular by attractive new vehicle
models offered by the Automobiles segment. The easing
of pressure on international capital markets in 2010 also
helped to improve margins generated in the Financial
Services segment.
The BMW Group recorded a net profit of euro 3,234 mil-
lion (2009: euro 210 million) for the financial year 2010.
The post-tax return on sales was 5.3% (2009: 0.4%).
Earnings per share of common and preferred stock were
euro 4.91 and euro 4.93 respectively (2009: euro 0.31 for
common stock and euro 0.33 for preferred stock).
Group revenues rose by 19.3% to euro 60,477 million
(2009: euro 50,681 million). Adjusted for exchange rate
factors, the increase would have been 14.4%. Revenues
from the sale of BMW, MINI and Rolls-Royce brand cars
climbed by 24.2% due to higher sales volumes. Motor-