BMW 2010 Annual Report Download - page 113
Download and view the complete annual report
Please find page 113 of the 2010 BMW annual report below. You can navigate through the pages in the report by either clicking on the pages listed below, or by using the keyword search tool below to find specific information within the annual report.-
 1
1 -
2
-
3
-
4
-
5
-
6
-
7
-
8
-
9
-
10
-
11
-
12
-
13
-
14
-
15
-
16
-
17
-
18
-
19
-
20
-
21
-
22
-
23
-
24
-
25
-
26
-
27
-
28
-
29
-
30
-
31
-
32
-
33
-
34
-
35
-
36
-
37
-
38
-
39
-
40
-
41
-
42
-
43
-
44
-
45
-
46
-
47
-
48
-
49
-
50
-
51
-
52
-
53
-
54
-
55
-
56
-
57
-
58
-
59
-
60
-
61
-
62
-
63
-
64
-
65
-
66
-
67
-
68
-
69
-
70
-
71
-
72
-
73
-
74
-
75
-
76
-
77
-
78
-
79
-
80
-
81
-
82
-
83
-
84
-
85
-
86
-
87
-
88
-
89
-
90
-
91
-
92
-
93
-
94
-
95
-
96
-
97
-
98
-
99
-
100
-
101
-
102
-
 103
103 -
 104
104 -
 105
105 -
 106
106 -
 107
107 -
 108
108 -
 109
109 -
 110
110 -
 111
111 -
 112
112 -
 113
113 -
 114
114 -
 115
115 -
 116
116 -
 117
117 -
 118
118 -
 119
119 -
 120
120 -
 121
121 -
 122
122 -
 123
123 -
124
-
125
-
126
-
127
-
128
-
129
-
130
-
131
-
132
-
133
-
134
-
135
-
136
-
137
-
138
-
139
-
140
-
141
-
142
-
143
-
144
-
145
-
146
-
147
-
148
-
149
-
150
-
151
-
152
-
153
-
154
-
155
-
156
-
157
-
158
-
159
-
160
-
161
-
162
-
163
-
164
-
165
-
166
-
167
-
168
-
169
-
170
-
171
-
172
-
173
-
174
-
175
-
176
-
177
-
178
-
179
-
180
-
181
-
182
-
183
-
184
-
185
-
186
-
187
-
188
-
189
-
190
-
191
-
192
-
193
-
194
-
195
-
196
-
197
-
198
-
199
-
200
-
201
-
202
-
203
-
204
-
205
-
206
-
207
-
208
-
209
-
210
-
211
-
212
-
213
-
214
-
215
-
216
-
217
-
218
-
219
-
220
-
221
-
222
-
223
-
224
-
225
-
226
-
227
-
228
-
229
-
230
-
231
-
232
-
233
-
234
-
235
-
236
-
237
-
238
-
239
-
240
-
241
-
242
-
243
-
244
-
245
-
246
-
247
-
248
-
249
-
250
-
251
-
252
-
253
-
254
-
255
-
256
-
257
-
258
-
259
-
260
-
261
-
262
-
263
-
264
-
265
-
266
-
267
-
268
-
269
-
270
-
271
-
272
-
273
-
274
-
275
-
276
-
277
-
278
-
279
-
280
-
281
-
282
 |
 |

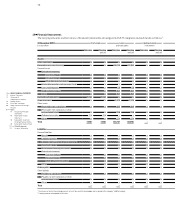
111 GROUP FINANCIAL STATEMENTS
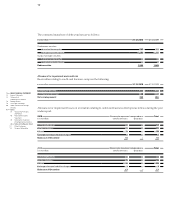
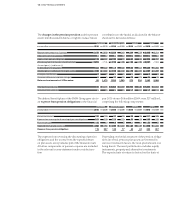
Other
Defined benefit obligation Plan assets Net obligation
in euro million 2010 2009 2010 2009 2010 2009
1 January 569 537 – 346 – 277 223 260
Effect of first-time consolidation 1 – – – 1 –
Expense from pension obligations and
expected return on plan assets 70 62 – 20 –19 50 43
Payments to external funds – – – 35 – 54 – 35 – 54
Employee contributions 2 2 – 2 – 2 – –
Payments on account and pension payments –18 –19 15 15 – 3 – 4
Actuarial gains (–) and losses (+) 25 – 4 –15 –15 10 –19
Translation differences and other changes 53 – 9 – 33 6 20 – 3
31 December 702 569 – 436 – 346 266 223
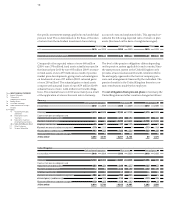
Components of plan assets
Germany United Kingdom Other countries To t a l
in euro million 2010 2009 2010 2009 2010 2009 2010 2009
Equity instruments 1,368 1,020 1,082 823 197 165 2,647 2,008
Debt securities 3,167 1,835 2,843 2,951 153 142 6,163 4,928
Real estate – – 430 315 26 20 456 335
Other 672 289 457 398 60 19 1,189 706
31 December 5,207 3,144 4,812 4,487 436 346 10,455 7,977
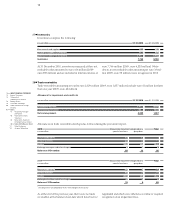
Plan assets in Germany, the UK and other countries comprised the following:
A substantial portion of plan assets is invested in debt
s ecurities in order to minimise the effect of capital market
fluctuations. Other investment classes, such as stocks
and shares, serve to generate higher rates of return. This
is necessary to cover risks (such as changes in morbidity
tables) not taken into account in the actuarial assumptions
applied. The financial risk of pension payments having
to be made for longer than the calculated period is also
Actuarial gains on benefit obligations, mostly attributable
to experience adjustments, amounted to euro 76 million
(2009: euro 22 million).
hedged for pensioners in the UK by a so-called “longevity
hedge”.
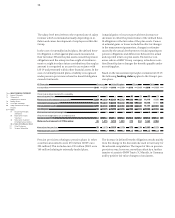
The present value of the defined benefit obligations and
the fair values of fund assets – as well as the actuarial
adjustments made for those two items – have developed
as follows over the last five years:
Experience adjustments relating to fund assets also re-
sulted in actuarial gains of euro 221 million in the finan-
cial year under report (2009: euro 289 million).
in euro million 2010 2009 2008 2007 2006
Defined benefit obligation 12,008 10,931 8,788 10,631 11,430
Fair value of plan assets 10,455 7,977 5,491 6,029 6,432
Net obligation 1,553 2,954 3,297 4,602 4,998
Actuarial gains (–) and losses (+) on defined benefit obligations 459 1,464 – 919 – 557 – 400
Actuarial gains (–) and losses (+) on plan assets – 227 – 289 868 44 –117