BMW 2010 Annual Report Download - page 15
Download and view the complete annual report
Please find page 15 of the 2010 BMW annual report below. You can navigate through the pages in the report by either clicking on the pages listed below, or by using the keyword search tool below to find specific information within the annual report.-
 1
1 -
2
-
3
-
4
-
 5
5 -
 6
6 -
 7
7 -
 8
8 -
 9
9 -
 10
10 -
 11
11 -
 12
12 -
 13
13 -
 14
14 -
 15
15 -
 16
16 -
 17
17 -
 18
18 -
 19
19 -
 20
20 -
 21
21 -
 22
22 -
 23
23 -
 24
24 -
 25
25 -
26
-
27
-
28
-
29
-
30
-
31
-
32
-
33
-
34
-
35
-
36
-
37
-
38
-
39
-
40
-
41
-
42
-
43
-
44
-
45
-
46
-
47
-
48
-
49
-
50
-
51
-
52
-
53
-
54
-
55
-
56
-
57
-
58
-
59
-
60
-
61
-
62
-
63
-
64
-
65
-
66
-
67
-
68
-
69
-
70
-
71
-
72
-
73
-
74
-
75
-
76
-
77
-
78
-
79
-
80
-
81
-
82
-
83
-
84
-
85
-
86
-
87
-
88
-
89
-
90
-
91
-
92
-
93
-
94
-
95
-
96
-
97
-
98
-
99
-
100
-
101
-
102
-
103
-
104
-
105
-
106
-
107
-
108
-
109
-
110
-
111
-
112
-
113
-
114
-
115
-
116
-
117
-
118
-
119
-
120
-
121
-
122
-
123
-
124
-
125
-
126
-
127
-
128
-
129
-
130
-
131
-
132
-
133
-
134
-
135
-
136
-
137
-
138
-
139
-
140
-
141
-
142
-
143
-
144
-
145
-
146
-
147
-
148
-
149
-
150
-
151
-
152
-
153
-
154
-
155
-
156
-
157
-
158
-
159
-
160
-
161
-
162
-
163
-
164
-
165
-
166
-
167
-
168
-
169
-
170
-
171
-
172
-
173
-
174
-
175
-
176
-
177
-
178
-
179
-
180
-
181
-
182
-
183
-
184
-
185
-
186
-
187
-
188
-
189
-
190
-
191
-
192
-
193
-
194
-
195
-
196
-
197
-
198
-
199
-
200
-
201
-
202
-
203
-
204
-
205
-
206
-
207
-
208
-
209
-
210
-
211
-
212
-
213
-
214
-
215
-
216
-
217
-
218
-
219
-
220
-
221
-
222
-
223
-
224
-
225
-
226
-
227
-
228
-
229
-
230
-
231
-
232
-
233
-
234
-
235
-
236
-
237
-
238
-
239
-
240
-
241
-
242
-
243
-
244
-
245
-
246
-
247
-
248
-
249
-
250
-
251
-
252
-
253
-
254
-
255
-
256
-
257
-
258
-
259
-
260
-
261
-
262
-
263
-
264
-
265
-
266
-
267
-
268
-
269
-
270
-
271
-
272
-
273
-
274
-
275
-
276
-
277
-
278
-
279
-
280
-
281
-
282
 |
 |

13 GROUP MANAGEMENT REPORT
19 million) and the profit before tax totalled euro 65 mil-
lion (2009: euro 11 million).
Financial Services business also benefited from the eco-
nomic recovery, with segment revenues rising to euro
16,617 million (+5.2%). At euro 1,201 million, segment
EBIT was well up on the previous year (2009: euro 355 mil-
lion),
while pre-tax segment profit rose to euro 1,214 mil-
lion (2009: euro 365 million).
The tax expense for 2010 totalled euro 1,602 million (2009:
euro 203 million). The effective tax rate for the year
de-
creased by 16.1 percentage points to 33.1%. The Group
reported a net profit for the year of euro 3,234 million,
asignificant improvement on the previous year (2009:
euro 210 million).
Dividend raised sharply
Reflecting the very strong earnings performance, the
Board of Management and Supervisory Board propose to
the Annual General Meeting to use the unappropriated
profit available for distribution in BMW AG totalling euro
852 million to pay a dividend of euro 1.30 for each share
of common stock (2009: euro 0.30) and euro 1.32 for each
share of preferred stock (2009: euro 0.32). The distribution
rate for 2010 would then be 26.5%.
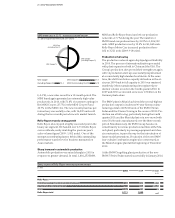
Capital expenditure reduced
Capital expenditure in 2010 amounted to euro 3,263 mil-
lion, 6.0% below the previous year’s figure (2009: euro
3,471 million). The two main focal points were product
investments for the start-up of new models such as the
BMW X3, the 5 Series, the 6 Series Convertible and the
MINI Countryman on the one hand and investments in
infrastructure on the other.
In 2010 we invested euro 2,312 million in property, plant
and equipment and other intangible assets (2009: euro
2,384 million; –3.0%). In addition, development expend-
iture of euro 951 million was recognised as assets (2009:
euro 1,087 million; –12.5%). The percentage of develop-
ment costs capitalised decreased to 34.3% (2009: 44.4%).
The capital expenditure ratio (capital expenditure as a
percentage of Group revenues) fell to 5.4% in 2010 (2009:
6.8%). Due to development-related factors and despite
our investment in innovative products and technologies,
the ratio remained below 7% of Group revenues and
thuswithin the target range set in conjunction with the
Group’s Strategy Number ONE.
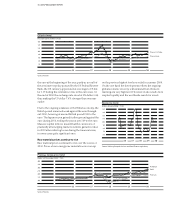
BMW Group Capital expenditure and operating cash flow
in euro million
8,000
7,000
6,000
5,000
4,000
3,000
2,000
06 07 08 09 10
Capital
expenditure 4,313 4,267 4,204 3,471 3,263
Operating
cash flow* 5,373 6,246 4,471 4,921 8,150
*
reported in the cash flow statement up to 2006 as cash inflow from operating activities
of Industrial Operations and from 2007 as cash inflow from operating activities of the
Automobiles segment