The Hartford 2009 Annual Report Download - page 98
Download and view the complete annual report
Please find page 98 of the 2009 The Hartford annual report below. You can navigate through the pages in the report by either clicking on the pages listed below, or by using the keyword search tool below to find specific information within the annual report.-
 1
1 -
2
-
3
-
4
-
5
-
6
-
7
-
8
-
9
-
10
-
11
-
12
-
13
-
14
-
15
-
16
-
17
-
18
-
19
-
20
-
21
-
22
-
23
-
24
-
25
-
26
-
27
-
28
-
29
-
30
-
31
-
32
-
33
-
34
-
35
-
36
-
37
-
38
-
39
-
40
-
41
-
42
-
43
-
44
-
45
-
46
-
47
-
48
-
49
-
50
-
51
-
52
-
53
-
54
-
55
-
56
-
57
-
58
-
59
-
60
-
61
-
62
-
63
-
64
-
65
-
66
-
67
-
68
-
69
-
70
-
71
-
72
-
73
-
74
-
75
-
76
-
77
-
78
-
79
-
80
-
81
-
82
-
83
-
84
-
85
-
86
-
87
-
 88
88 -
 89
89 -
 90
90 -
 91
91 -
 92
92 -
 93
93 -
 94
94 -
 95
95 -
 96
96 -
 97
97 -
 98
98 -
 99
99 -
 100
100 -
 101
101 -
 102
102 -
 103
103 -
 104
104 -
 105
105 -
 106
106 -
 107
107 -
 108
108 -
109
-
110
-
111
-
112
-
113
-
114
-
115
-
116
-
117
-
118
-
119
-
120
-
121
-
122
-
123
-
124
-
125
-
126
-
127
-
128
-
129
-
130
-
131
-
132
-
133
-
134
-
135
-
136
-
137
-
138
-
139
-
140
-
141
-
142
-
143
-
144
-
145
-
146
-
147
-
148
-
149
-
150
-
151
-
152
-
153
-
154
-
155
-
156
-
157
-
158
-
159
-
160
-
161
-
162
-
163
-
164
-
165
-
166
-
167
-
168
-
169
-
170
-
171
-
172
-
173
-
174
-
175
-
176
-
177
-
178
-
179
-
180
-
181
-
182
-
183
-
184
-
185
-
186
-
187
-
188
-
189
-
190
-
191
-
192
-
193
-
194
-
195
-
196
-
197
-
198
-
199
-
200
-
201
-
202
-
203
-
204
-
205
-
206
-
207
-
208
-
209
-
210
-
211
-
212
-
213
-
214
-
215
-
216
-
217
-
218
-
219
-
220
-
221
-
222
-
223
-
224
-
225
-
226
-
227
-
228
-
229
-
230
-
231
-
232
-
233
-
234
-
235
-
236
-
237
-
238
-
239
-
240
-
241
-
242
-
243
-
244
-
245
-
246
-
247
-
248
-
249
-
250
-
251
-
252
-
253
-
254
-
255
-
256
-
257
-
258
-
259
-
260
-
261
-
262
-
263
-
264
-
265
-
266
-
267
 |
 |

98
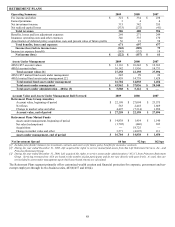
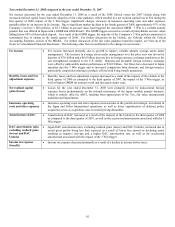
New business
premium
• Auto and homeowners’ new business written premium increased by $91, or 25% and $43 or 41%,
respectively, in 2009. AARP new business written premium increased for both auto and home primarily
due to increased direct marketing spend, higher auto policy conversion rates and cross-selling homeowners’
insurance to insureds who have auto policies. Agency new business written premium increased for both
auto and home primarily due to an increase in the number of agency appointments, an increase in the
number of policy quotes and an increase in the policy issue rate for auto.
Policy count
retention
• Policy count retention for auto remained flat in 2009 for both AARP and Agency policies, primarily due to
stable renewal written pricing increases and policy retention initiatives. Policy count retention for
homeowners decreased slightly in 2009, primarily due to a decrease in policy retention for Agency business
largely due to the Company’ s decision to stop renewing Florida homeowners’ policies.
Renewal earned
pricing increase
• The increases in renewal earned pricing during 2009 were primarily a reflection of written pricing changes
over the last two years. Renewal written pricing in 2009 increased in auto by 3% due to rate increases and
the effect of policyholders purchasing newer vehicle models in place of older models. Homeowners’
renewal written pricing increased by 5% due to rate increases and increased coverage amounts reflecting
higher rebuilding costs. For both auto and home, the Company has increased rates in certain states for
certain classes of business to maintain profitability in the face of rising loss costs.
Policies in-force • The number of policies in-force increased 3% in auto, driven by an increase in both AARP and Agency and
increased 2% for homeowners, driven by an increase in AARP.
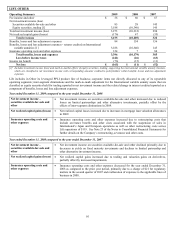
Losses and loss adjustment expenses
Current accident year losses and loss adjustment expenses before catastrophes
Personal Lines current accident year losses and loss adjustment expenses before catastrophes increased by $158, primarily due to the
increase in the current accident year loss and loss adjustment expense ratio before catastrophes. The current accident year loss and loss
adjustment expense ratio before catastrophes increased by 3.5 points, driven by a 3.3 point increase for auto and a 4.2 point increase for
home. The 3.3 point increase for auto was due to an increase in expected liability loss costs, an increase in physical damage frequency
and a decline in average premium. After a historically low claim frequency in 2008, auto claim frequency increased in 2009, mostly in
bodily injury coverage, driven by an increase in miles driven. The 4.2 point increase for home was driven by increasing severity in
AARP, increasing frequency in Agency and a decline in average premium in Agency.
Current accident year catastrophes
Current accident year catastrophes decreased by $30 as catastrophe losses in 2008, driven by losses from hurricane Ike and from wind
and thunderstorms, were higher than catastrophe losses in 2009, driven by losses from hail and windstorms in Colorado, the Midwest
and the Southeast.
Prior accident year reserve development
Net favorable reserve development was $18 lower in 2009. Net favorable reserve development of $33 in 2009 included, among other
reserve changes, a $77 release of auto liability reserves principally related to AARP business for the 2006 through 2008 accident years,
partially offset by an $18 strengthening of reserves for homeowners’ claims for the 2005 through 2008 accident years. Net favorable
reserve development of $51 in 2008 included a $46 release of auto liability reserves, primarily related to accident years 2005 to 2007
and a $24 release of reserves for extra-contractual liability claims under non-standard personal auto policies.
Operating expenses
The expense ratio increased by 0.9 points due largely to higher amortization of deferred acquisition costs and an increase in other non-
deferrable costs, partially offset by a decrease in TWIA assessments of $17. Amortization of acquisition costs increased for both AARP
business and for business sold direct to the consumer in four pilot states.