The Hartford 2009 Annual Report Download - page 102
Download and view the complete annual report
Please find page 102 of the 2009 The Hartford annual report below. You can navigate through the pages in the report by either clicking on the pages listed below, or by using the keyword search tool below to find specific information within the annual report.-
 1
1 -
2
-
3
-
4
-
5
-
6
-
7
-
8
-
9
-
10
-
11
-
12
-
13
-
14
-
15
-
16
-
17
-
18
-
19
-
20
-
21
-
22
-
23
-
24
-
25
-
26
-
27
-
28
-
29
-
30
-
31
-
32
-
33
-
34
-
35
-
36
-
37
-
38
-
39
-
40
-
41
-
42
-
43
-
44
-
45
-
46
-
47
-
48
-
49
-
50
-
51
-
52
-
53
-
54
-
55
-
56
-
57
-
58
-
59
-
60
-
61
-
62
-
63
-
64
-
65
-
66
-
67
-
68
-
69
-
70
-
71
-
72
-
73
-
74
-
75
-
76
-
77
-
78
-
79
-
80
-
81
-
82
-
83
-
84
-
85
-
86
-
87
-
88
-
89
-
90
-
91
-
 92
92 -
 93
93 -
 94
94 -
 95
95 -
 96
96 -
 97
97 -
 98
98 -
 99
99 -
 100
100 -
 101
101 -
 102
102 -
 103
103 -
 104
104 -
 105
105 -
 106
106 -
 107
107 -
 108
108 -
 109
109 -
 110
110 -
 111
111 -
 112
112 -
113
-
114
-
115
-
116
-
117
-
118
-
119
-
120
-
121
-
122
-
123
-
124
-
125
-
126
-
127
-
128
-
129
-
130
-
131
-
132
-
133
-
134
-
135
-
136
-
137
-
138
-
139
-
140
-
141
-
142
-
143
-
144
-
145
-
146
-
147
-
148
-
149
-
150
-
151
-
152
-
153
-
154
-
155
-
156
-
157
-
158
-
159
-
160
-
161
-
162
-
163
-
164
-
165
-
166
-
167
-
168
-
169
-
170
-
171
-
172
-
173
-
174
-
175
-
176
-
177
-
178
-
179
-
180
-
181
-
182
-
183
-
184
-
185
-
186
-
187
-
188
-
189
-
190
-
191
-
192
-
193
-
194
-
195
-
196
-
197
-
198
-
199
-
200
-
201
-
202
-
203
-
204
-
205
-
206
-
207
-
208
-
209
-
210
-
211
-
212
-
213
-
214
-
215
-
216
-
217
-
218
-
219
-
220
-
221
-
222
-
223
-
224
-
225
-
226
-
227
-
228
-
229
-
230
-
231
-
232
-
233
-
234
-
235
-
236
-
237
-
238
-
239
-
240
-
241
-
242
-
243
-
244
-
245
-
246
-
247
-
248
-
249
-
250
-
251
-
252
-
253
-
254
-
255
-
256
-
257
-
258
-
259
-
260
-
261
-
262
-
263
-
264
-
265
-
266
-
267
 |
 |

102
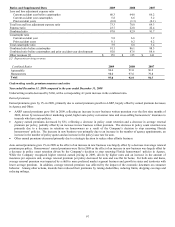
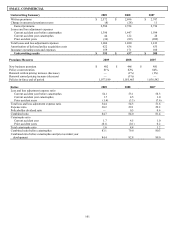
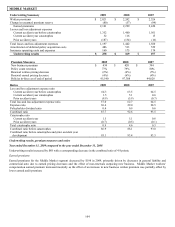
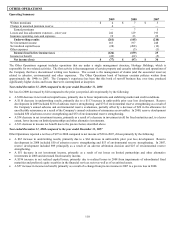
Underwriting results, premium measures and ratios
Year ended December 31, 2009 compared to the year ended December 31, 2008
Underwriting results decreased by $42, with a corresponding 0.7 point increase in the combined ratio.
Earned premiums
Earned premiums for the Small Commercial segment decreased by $144 in 2009 primarily due to lower earned audit premium on
workers’ compensation business and the effect of non-renewals outpacing new business over the last two years for package business and
commercial auto. While the Company has focused on increasing new business from its agents and expanding writings in certain
territories, the effects of the economic downturn and competitor actions to increase market share and increase business appetite in
certain classes of risks have contributed to the decrease in earned premiums in 2009.
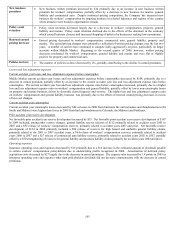
New business
premium
• New business written premium was up $36, or 8%, in 2009 primarily driven by an increase in workers’
compensation business and the impact from the rollout of a new business owners policy product during the
second half of 2009. The Company continues to increase its new business for workers’ compensation
through refinement of pricing and underwriting appetite in certain markets.
Policy count
retention
• Policy count retention decreased slightly due to the impact from declining economic conditions including
increased mid-term cancellations. The impact affected all lines of business.
Renewal earned
pricing increase
(decrease)
• Renewal earned pricing was flat as an increase in renewal earned pricing for package business was offset by
a decrease for workers’ compensation. Renewal earned pricing for the commercial auto business was
essentially flat. The earned pricing changes were primarily a reflection of written pricing changes over the
last two years. In addition to the effect of written pricing decreases in workers’ compensation, average
premium per policy in Small Commercial has declined due to a reduction in the payrolls of workers’
compensation insureds and the effect of declining endorsements.
Policies in-force • The number of policies-in-force increased by 2% in 2009. Despite the growth in policies, earned premiums
have decreased by 5%, reflecting the decrease in average premium per policy. The growth or decline in
policies in-force does not correspond directly with the change in earned premiums due to the effect of
changes in earned pricing and changes in the average premium per policy.
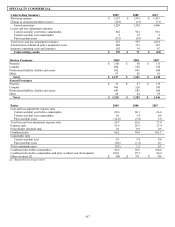
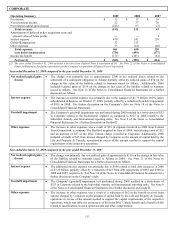
Losses and loss adjustment expenses
Current accident year losses and loss adjustment expenses before catastrophes
Small Commercial’ s current accident year losses and loss adjustment expenses before catastrophes decreased by $51, primarily due to
the decrease in earned premiums, partially offset by a 1.0 point increase in the current accident year loss and loss adjustment expense
ratio before catastrophes. The increase in this ratio was primarily due to a higher loss and loss adjustment expense ratio on workers’
compensation and package business. The higher loss and loss adjustment expense ratio on workers’ compensation business reflected
the effect of a 2009 decrease in estimated audit premium related to exposures earned in 2008, partially offset by a continuation of
favorable expected frequency.
Current accident year catastrophes
Current accident year catastrophe losses decreased by $78 in 2009, as losses in 2008 from hurricane Ike and tornadoes and
thunderstorms in the South and Midwest were higher than catastrophe losses in 2009 from hail and windstorms in Colorado, the
Midwest and the Southeast.
Prior accident year reserve development
Net favorable prior accident year development decreased by $53 in 2009. Net favorable prior accident year development of $36 in 2009
included a $40 release of workers' compensation reserves related to accident years 2007 and prior, a $33 release of commercial auto
liability reserves and a $38 strengthening of reserves for package business. Net favorable prior accident year development of $89 in
2008 included a $92 release of workers' compensation reserves related to accident years 2000 to 2007.
Operating expenses
Insurance operating costs and expenses decreased by $12, driven by a decrease in TWIA assessments of $12 and an increase in the
estimated amount of dividends payable to certain workers’ compensation policyholders due to underwriting profits of $8 recognized in
2008, partially offset by an increase in compensation-related costs and higher IT costs. Amortization of deferred policy acquisition
costs decreased by $14 in 2009, primarily driven by the decrease in earned premiums, partially offset by higher amortization of other
underwriting expenses. The expense ratio increased by 1.1 points, primarily due to the decrease in earned premiums, partially offset by
the decrease in TWIA assessments.