The Hartford 2009 Annual Report Download - page 125
Download and view the complete annual report
Please find page 125 of the 2009 The Hartford annual report below. You can navigate through the pages in the report by either clicking on the pages listed below, or by using the keyword search tool below to find specific information within the annual report.-
 1
1 -
2
-
3
-
4
-
5
-
6
-
7
-
8
-
9
-
10
-
11
-
12
-
13
-
14
-
15
-
16
-
17
-
18
-
19
-
20
-
21
-
22
-
23
-
24
-
25
-
26
-
27
-
28
-
29
-
30
-
31
-
32
-
33
-
34
-
35
-
36
-
37
-
38
-
39
-
40
-
41
-
42
-
43
-
44
-
45
-
46
-
47
-
48
-
49
-
50
-
51
-
52
-
53
-
54
-
55
-
56
-
57
-
58
-
59
-
60
-
61
-
62
-
63
-
64
-
65
-
66
-
67
-
68
-
69
-
70
-
71
-
72
-
73
-
74
-
75
-
76
-
77
-
78
-
79
-
80
-
81
-
82
-
83
-
84
-
85
-
86
-
87
-
88
-
89
-
90
-
91
-
92
-
93
-
94
-
95
-
96
-
97
-
98
-
99
-
100
-
101
-
102
-
103
-
104
-
105
-
106
-
107
-
108
-
109
-
110
-
111
-
112
-
113
-
114
-
 115
115 -
 116
116 -
 117
117 -
 118
118 -
 119
119 -
 120
120 -
 121
121 -
 122
122 -
 123
123 -
 124
124 -
 125
125 -
 126
126 -
 127
127 -
 128
128 -
 129
129 -
 130
130 -
 131
131 -
 132
132 -
 133
133 -
 134
134 -
 135
135 -
136
-
137
-
138
-
139
-
140
-
141
-
142
-
143
-
144
-
145
-
146
-
147
-
148
-
149
-
150
-
151
-
152
-
153
-
154
-
155
-
156
-
157
-
158
-
159
-
160
-
161
-
162
-
163
-
164
-
165
-
166
-
167
-
168
-
169
-
170
-
171
-
172
-
173
-
174
-
175
-
176
-
177
-
178
-
179
-
180
-
181
-
182
-
183
-
184
-
185
-
186
-
187
-
188
-
189
-
190
-
191
-
192
-
193
-
194
-
195
-
196
-
197
-
198
-
199
-
200
-
201
-
202
-
203
-
204
-
205
-
206
-
207
-
208
-
209
-
210
-
211
-
212
-
213
-
214
-
215
-
216
-
217
-
218
-
219
-
220
-
221
-
222
-
223
-
224
-
225
-
226
-
227
-
228
-
229
-
230
-
231
-
232
-
233
-
234
-
235
-
236
-
237
-
238
-
239
-
240
-
241
-
242
-
243
-
244
-
245
-
246
-
247
-
248
-
249
-
250
-
251
-
252
-
253
-
254
-
255
-
256
-
257
-
258
-
259
-
260
-
261
-
262
-
263
-
264
-
265
-
266
-
267
 |
 |

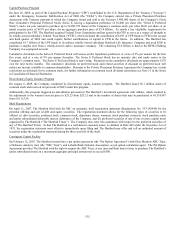
125
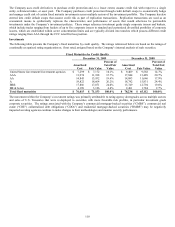
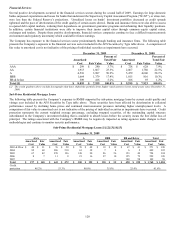
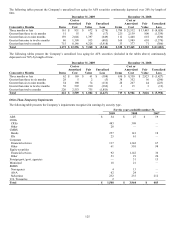
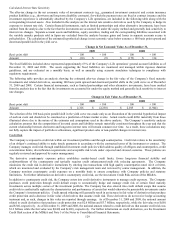
The following tables present the Company’ s unrealized loss aging for AFS securities continuously depressed over 20% by length of
time.
December 31, 2009 December 31, 2008
Consecutive Months
Items
Cost or
Amortized
Cost
Fair
Value
Unrealized
Loss
Items
Cost or
Amortized
Cost
Fair
Value
Unrealized
Loss
Three months or less 161 $ 951 $ 672 $ (279) 1,789 $ 21,512 $ 13,483 $ (8,029)
Greater than three to six months 51 55 38 (17) 225 2,139 800 (1,339)
Greater than six to nine months 159 2,046 1,397 (649) 112 1,448 618 (830)
Greater than nine to twelve months 86 1,398 913 (485) 169 1,989 610 (1,379)
Greater than twelve months 715 8,146 4,228 (3,918) 33 377 71 (306)
Total 1,172 $ 12,596 $ 7,248 $ (5,348) 2,328 $ 27,465 $ 15,582 $ (11,883)
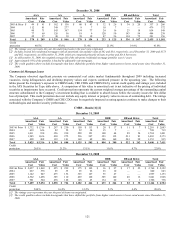
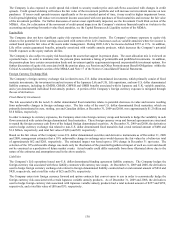
The following tables present the Company’ s unrealized loss aging for AFS securities (included in the tables above) continuously
depressed over 50% by length of time.
December 31, 2009 December 31, 2008
Consecutive Months
Items
Cost or
Amortized
Cost
Fair
Value
Unrealized
Loss
Items
Cost or
Amortized
Cost
Fair
Value
Unrealized
Loss
Three months or less 62 $ 169 $ 61 $ (108) 650 $ 8,350 $ 2,923 $ (5,427)
Greater than three to six months 28 5 2 (3) 38 352 56 (296)
Greater than six to nine months 54 190 74 (116) 28 267 44 (223)
Greater than nine to twelve months 58 592 210 (382) 3 15 3 (12)
Greater than twelve months 220 2,553 735 (1,818) — — — —
Total 422 $ 3,509 $ 1,082 $ (2,427) 719 $ 8,984 $ 3,026 $ (5,958)
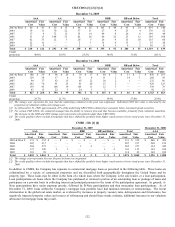
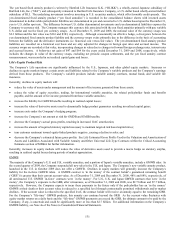
Other-Than-Temporary Impairments
The following table presents the Company’ s impairments recognized in earnings by security type.
For the years ended December 31,
2009 2008 2007
ABS $54 $ 27 $ 19
CDOs
CREs 483 398 —
Other 28 — —
CMBS
Bonds 257 141 18
IOs 25 61 —
Corporate
Financial services 137 1,342 67
Other 61 510 98
Equity securities
Financial services 92 1,142 36
Other 53 19 20
Foreign govt./govt. agencies — 31 13
Municipal 18 21 —
RMBS
Non-agency 4 13 —
Alt-A 62 24 —
Sub-prime 232 235 212
U.S. Treasuries 2 — —
Total $1,508 $ 3,964 $483