The Hartford 2009 Annual Report Download - page 55
Download and view the complete annual report
Please find page 55 of the 2009 The Hartford annual report below. You can navigate through the pages in the report by either clicking on the pages listed below, or by using the keyword search tool below to find specific information within the annual report.-
 1
1 -
2
-
3
-
4
-
5
-
6
-
7
-
8
-
9
-
10
-
11
-
12
-
13
-
14
-
15
-
16
-
17
-
18
-
19
-
20
-
21
-
22
-
23
-
24
-
25
-
26
-
27
-
28
-
29
-
30
-
31
-
32
-
33
-
34
-
35
-
36
-
37
-
38
-
39
-
40
-
41
-
42
-
43
-
44
-
 45
45 -
 46
46 -
 47
47 -
 48
48 -
 49
49 -
 50
50 -
 51
51 -
 52
52 -
 53
53 -
 54
54 -
 55
55 -
 56
56 -
 57
57 -
 58
58 -
 59
59 -
 60
60 -
 61
61 -
 62
62 -
 63
63 -
 64
64 -
 65
65 -
66
-
67
-
68
-
69
-
70
-
71
-
72
-
73
-
74
-
75
-
76
-
77
-
78
-
79
-
80
-
81
-
82
-
83
-
84
-
85
-
86
-
87
-
88
-
89
-
90
-
91
-
92
-
93
-
94
-
95
-
96
-
97
-
98
-
99
-
100
-
101
-
102
-
103
-
104
-
105
-
106
-
107
-
108
-
109
-
110
-
111
-
112
-
113
-
114
-
115
-
116
-
117
-
118
-
119
-
120
-
121
-
122
-
123
-
124
-
125
-
126
-
127
-
128
-
129
-
130
-
131
-
132
-
133
-
134
-
135
-
136
-
137
-
138
-
139
-
140
-
141
-
142
-
143
-
144
-
145
-
146
-
147
-
148
-
149
-
150
-
151
-
152
-
153
-
154
-
155
-
156
-
157
-
158
-
159
-
160
-
161
-
162
-
163
-
164
-
165
-
166
-
167
-
168
-
169
-
170
-
171
-
172
-
173
-
174
-
175
-
176
-
177
-
178
-
179
-
180
-
181
-
182
-
183
-
184
-
185
-
186
-
187
-
188
-
189
-
190
-
191
-
192
-
193
-
194
-
195
-
196
-
197
-
198
-
199
-
200
-
201
-
202
-
203
-
204
-
205
-
206
-
207
-
208
-
209
-
210
-
211
-
212
-
213
-
214
-
215
-
216
-
217
-
218
-
219
-
220
-
221
-
222
-
223
-
224
-
225
-
226
-
227
-
228
-
229
-
230
-
231
-
232
-
233
-
234
-
235
-
236
-
237
-
238
-
239
-
240
-
241
-
242
-
243
-
244
-
245
-
246
-
247
-
248
-
249
-
250
-
251
-
252
-
253
-
254
-
255
-
256
-
257
-
258
-
259
-
260
-
261
-
262
-
263
-
264
-
265
-
266
-
267
 |
 |

55
• The Wellington subcategory includes insureds that entered into the “Wellington Agreement” dated June 19, 1985. The Wellington
Agreement provided terms and conditions for how the signatory asbestos producers would access their coverage from the
signatory insurers.
• The Other Major Asbestos Defendants subcategory represents insureds included in Tiers 1 and 2, as defined by Tillinghast that are
not Wellington signatories and have not entered into structured settlements with The Hartford. The Tier 1 and 2 classifications are
meant to capture the insureds for which there is expected to be significant exposure to asbestos claims.
• Accounts with future expected exposures greater or less than $2.5 include accounts that are not major asbestos defendants.
• The Unallocated category includes an estimate of the reserves necessary for asbestos claims related to direct insureds that have not
previously tendered asbestos claims to the Company and exposures related to liability claims that may not be subject to an
aggregate limit under the applicable policies.
An account may move between categories from one evaluation to the next. For example, an account with future expected exposure of
greater than $2.5 in one evaluation may be reevaluated due to changing conditions and recategorized as less than $2.5 in a subsequent
evaluation or vice versa.
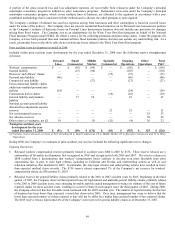
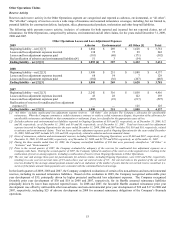
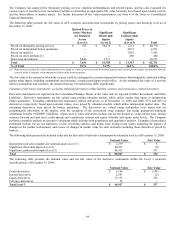
The following table displays gross asbestos reserves and other statistics by policyholder category as of December 31, 2009.
Summary of Gross Asbestos Reserves
As of December 31, 2009
Number of
Accounts [2]
All Time
Paid [3]
Total
Reserves
All Time
Ultimate [3]
Gross Asbestos Reserves as of June 30, 2009 [1]
Major asbestos defendants [5]
Structured settlements (includes 4 Wellington accounts) [6] 7 $ 270 $ 475 $ 745
Wellington (direct only) 29 904 43 947
Other major asbestos defendants 29 474 168 642
No known policies (includes 3 Wellington accounts) 5 — — —
Accounts with future exposure > $2.5 73 744 547 1,291
Accounts with future exposure < $2.5 1,104 424 119 543
Unallocated [7] 1,687 366 2,053
Total Direct 4,503 1,718 6,221
Assumed Reinsurance 1,110 557 1,667
London Market 581 347 928
Total as of June 30, 2009 [1] 6,194 2,622 8,816
Gross paid loss activity for the third quarter and fourth quarter 2009 143 (143) —
Gross incurred loss activity for the third quarter and fourth quarter 2009 — 5 5
Total as of December 31, 2009 [4] $6,337 $ 2,484 $ 8,821
[1] Gross Asbestos Reserves based on the second quarter 2009 asbestos reserve study.
[2] An account may move between categories from one evaluation to the next. Reclassifications were made as a result of the reserve evaluation
completed in the second quarter of 2009.
[3] "All Time Paid" represents the total payments with respect to the indicated claim type that have already been made by the Company as of the
indicated balance sheet date. "All Time Ultimate" represents the Company's estimate, as of the indicated balance sheet date, of the total payments
that are ultimately expected to be made to fully settle the indicated payment type. The amount is the sum of the amounts already paid (e.g. "All
Time Paid") and the estimated future payments (e.g. the amount shown in the column labeled "Total Reserves").
[4] Survival ratio is a commonly used industry ratio for comparing reserve levels between companies. While the method is commonly used, it is not a
predictive technique. Survival ratios may vary over time for numerous reasons such as large payments due to the final resolution of certain
asbestos liabilities, or reserve re-estimates. The survival ratio is computed by dividing the recorded reserves by the average of the past three
years of payments. The ratio is the calculated number of years the recorded reserves would survive if future annual payments were equal to the
average annual payments for the past three years. The 3-year gross survival ratio of 8.0 as of December 31, 2009 is computed based on total paid
losses of $937 for the period from January 1, 2007 to December 31, 2009. As of December 31, 2009, the one year gross paid amount for total
asbestos claims is $245 resulting in a one year gross survival ratio of 10.1.
[5] Includes 25 open accounts at both June 30, 2009 and 2008.
[6] Structured settlements include the Company’s reserves related to PPG Industries, Inc. (“PPG”). In January 2009, the Company, along with
approximately three dozen other insurers, entered into a modified agreement in principle with PPG to resolve the Company’s coverage
obligations for all of its PPG asbestos liabilities, including principally those arising out of its 50% stock ownership of Pittsburgh Corning
Corporation (“PCC”), a joint venture with Corning, Inc. The agreement is contingent on the fulfillment of certain conditions, including the
confirmation of a PCC plan of reorganization under Section 524(g) of the Bankruptcy Code, which have not yet been met.
[7] Includes closed accounts (exclusive of Major Asbestos Defendants) and unallocated IBNR.
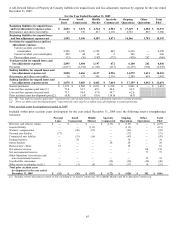
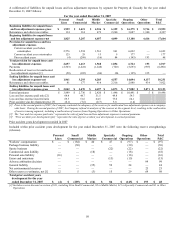
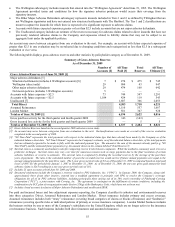
For paid and incurred losses and loss adjustment expenses reporting, the Company classifies its asbestos and environmental reserves
into three categories: Direct, Assumed Reinsurance and London Market. Direct insurance includes primary and excess coverage.
Assumed reinsurance includes both “treaty” reinsurance (covering broad categories of claims or blocks of business) and “facultative”
reinsurance (covering specific risks or individual policies of primary or excess insurance companies). London Market business includes
the business written by one or more of the Company’ s subsidiaries in the United Kingdom, which are no longer active in the insurance
or reinsurance business. Such business includes both direct insurance and assumed reinsurance.