The Hartford 2009 Annual Report Download - page 118
Download and view the complete annual report
Please find page 118 of the 2009 The Hartford annual report below. You can navigate through the pages in the report by either clicking on the pages listed below, or by using the keyword search tool below to find specific information within the annual report.-
 1
1 -
2
-
3
-
4
-
5
-
6
-
7
-
8
-
9
-
10
-
11
-
12
-
13
-
14
-
15
-
16
-
17
-
18
-
19
-
20
-
21
-
22
-
23
-
24
-
25
-
26
-
27
-
28
-
29
-
30
-
31
-
32
-
33
-
34
-
35
-
36
-
37
-
38
-
39
-
40
-
41
-
42
-
43
-
44
-
45
-
46
-
47
-
48
-
49
-
50
-
51
-
52
-
53
-
54
-
55
-
56
-
57
-
58
-
59
-
60
-
61
-
62
-
63
-
64
-
65
-
66
-
67
-
68
-
69
-
70
-
71
-
72
-
73
-
74
-
75
-
76
-
77
-
78
-
79
-
80
-
81
-
82
-
83
-
84
-
85
-
86
-
87
-
88
-
89
-
90
-
91
-
92
-
93
-
94
-
95
-
96
-
97
-
98
-
99
-
100
-
101
-
102
-
103
-
104
-
105
-
106
-
107
-
 108
108 -
 109
109 -
 110
110 -
 111
111 -
 112
112 -
 113
113 -
 114
114 -
 115
115 -
 116
116 -
 117
117 -
 118
118 -
 119
119 -
 120
120 -
 121
121 -
 122
122 -
 123
123 -
 124
124 -
 125
125 -
 126
126 -
 127
127 -
 128
128 -
129
-
130
-
131
-
132
-
133
-
134
-
135
-
136
-
137
-
138
-
139
-
140
-
141
-
142
-
143
-
144
-
145
-
146
-
147
-
148
-
149
-
150
-
151
-
152
-
153
-
154
-
155
-
156
-
157
-
158
-
159
-
160
-
161
-
162
-
163
-
164
-
165
-
166
-
167
-
168
-
169
-
170
-
171
-
172
-
173
-
174
-
175
-
176
-
177
-
178
-
179
-
180
-
181
-
182
-
183
-
184
-
185
-
186
-
187
-
188
-
189
-
190
-
191
-
192
-
193
-
194
-
195
-
196
-
197
-
198
-
199
-
200
-
201
-
202
-
203
-
204
-
205
-
206
-
207
-
208
-
209
-
210
-
211
-
212
-
213
-
214
-
215
-
216
-
217
-
218
-
219
-
220
-
221
-
222
-
223
-
224
-
225
-
226
-
227
-
228
-
229
-
230
-
231
-
232
-
233
-
234
-
235
-
236
-
237
-
238
-
239
-
240
-
241
-
242
-
243
-
244
-
245
-
246
-
247
-
248
-
249
-
250
-
251
-
252
-
253
-
254
-
255
-
256
-
257
-
258
-
259
-
260
-
261
-
262
-
263
-
264
-
265
-
266
-
267
 |
 |

118
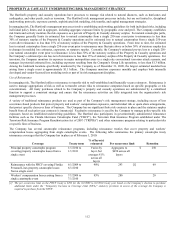
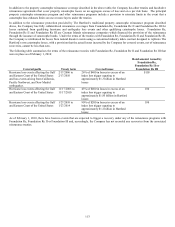
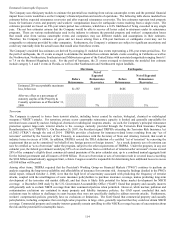
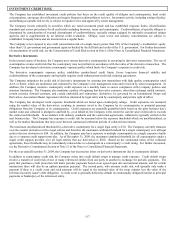
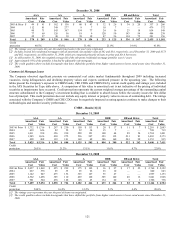
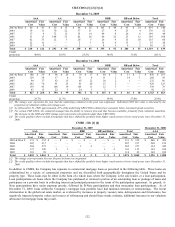
The Company uses credit derivatives to purchase credit protection and, to a lesser extent, assume credit risk with respect to a single
entity, referenced index, or asset pool. The Company purchases credit protection through credit default swaps to economically hedge
and manage credit risk of certain fixed maturity investments across multiple sectors of the investment portfolio. The Company has also
entered into credit default swaps that assume credit risk as part of replication transactions. Replication transactions are used as an
economical means to synthetically replicate the characteristics and performance of assets that would otherwise be permissible
investments under the Company’ s investment policies. These swaps reference investment grade single corporate issuers and baskets,
which include trades ranging from baskets of up to five corporate issuers to standard and customized diversified portfolios of corporate
issuers, which are established within sector concentration limits and are typically divided into tranches which possess different credit
ratings ranging from AAA through the CCC rated first loss position.
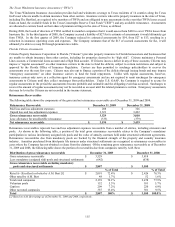
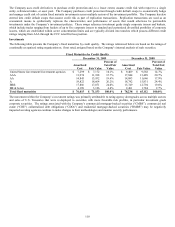
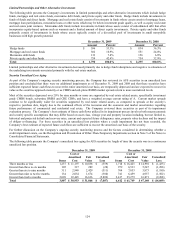
Investments
The following table presents the Company’ s fixed maturities by credit quality. The ratings referenced below are based on the ratings of
a nationally recognized rating organization or, if not rated, assigned based on the Company’ s internal analysis of such securities.
Fixed Maturities by Credit Quality
December 31, 2009 December 31, 2008
Amortized
Cost
Fair Value
Percent of
Total Fair
Value
Amortized
Cost
Fair Value
Percent of
Total Fair
Value
United States Government/Government agencies $ 7,299 $ 7,172 10.1% $ 9,409 $ 9,568 14.7%
AAA 11,974 11,188 15.7% 17,844 13,489 20.7%
AA 14,845 13,932 19.6% 14,093 11,646 17.9%
A 19,822 18,664 26.2% 18,742 15,831 24.4%
BBB 17,886 17,071 24.0% 15,749 12,794 19.6%
BB & below 4,189 3,126 4.4% 2,401 1,784 2.7%
Total fixed maturities $ 76,015 $ 71,153 100.0% $ 78,238 $ 65,112 100.0%
The movement within the Company’ s investment ratings was primarily attributable to rating agency downgrades across multiple sectors
and sales of U.S. Treasuries that were re-deployed to securities with more favorable risk profiles, in particular investment grade
corporate securities. The ratings associated with the Company’ s commercial mortgage-backed securities (“CMBS”), commercial real
estate (“CRE”) collateralized debt obligations (“CDOs”) and residential mortgage-backed securities (“RMBS”) may be negatively
impacted as rating agencies continue to make changes to their methodologies and monitor security performance.