The Hartford 2009 Annual Report Download - page 57
Download and view the complete annual report
Please find page 57 of the 2009 The Hartford annual report below. You can navigate through the pages in the report by either clicking on the pages listed below, or by using the keyword search tool below to find specific information within the annual report.
57
The Company provides an allowance for uncollectible reinsurance, reflecting management’ s best estimate of reinsurance cessions that
may be uncollectible in the future due to reinsurers’ unwillingness or inability to pay. During the second quarters of 2009, 2008 and
2007, the Company completed its annual evaluations of the collectability of the reinsurance recoverables and the adequacy of the
allowance for uncollectible reinsurance associated with older, long-term casualty liabilities reported in the Other Operations segment. In
conducting this evaluation, the Company used its most recent detailed evaluations of ceded liabilities reported in the segment. The
Company analyzed the overall credit quality of the Company’ s reinsurers, recent trends in arbitration and litigation outcomes in disputes
between cedants and reinsurers, and recent developments in commutation activity between reinsurers and cedants. As a result of the
second quarter of 2009 evaluation, the Company reduced its allowance for uncollectible reinsurance by $20 principally to reflect
decreased reinsurance recoverable dispute exposure and favorable activity since the last evaluation. As of December 31, 2009, the
allowance for uncollectible reinsurance for Other Operations totals $226. The evaluations in the second quarters of 2008 and 2007
resulted in no addition to the allowance for uncollectible reinsurance. The Company currently expects to perform its regular
comprehensive review of Other Operations reinsurance recoverables annually. Due to the inherent uncertainties as to collection and the
length of time before reinsurance recoverables become due, particularly for older, long-term casualty liabilities, it is possible that future
adjustments to the Company’ s reinsurance recoverables, net of the allowance, could be required.
Consistent with the Company’ s long-standing reserving practices, the Company will continue to review and monitor its reserves in the
Other Operations segment regularly and, where future developments indicate, make appropriate adjustments to the reserves.
Impact of Re-estimates
The establishment of Property and Casualty reserves is an estimation process, using a variety of methods, assumptions and data
elements. Ultimate losses may vary significantly from the current estimates. Many factors can contribute to these variations and the
need to change the previous estimate of required reserve levels. Subsequent changes can generally be thought of as being the result of
the emergence of additional facts that were not known or anticipated at the time of the prior reserve estimate and/or changes in
interpretations of information and trends.
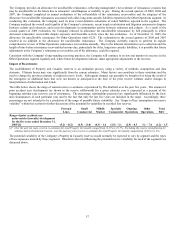
The table below shows the range of annual reserve re-estimates experienced by The Hartford over the past five years. The amount of
prior accident year development (as shown in the reserve rollforward) for a given calendar year is expressed as a percent of the
beginning calendar year reserves, net of reinsurance. The percentage relationships presented are significantly influenced by the facts
and circumstances of each particular year and by the fact that only the last five years are included in the range. Accordingly, these
percentages are not intended to be a prediction of the range of possible future variability. See “Impact of key assumptions on reserve
volatility” within this section for further discussion of the potential for variability in recorded loss reserves.
Personal
Lines
Small
Commercial
Middle
Market
Specialty
Commercial
Ongoing
Operations
Other
Operations
Total
P&C
Range of prior accident year
unfavorable (favorable) development
for the five years ended December 31,
2009 [1] (5.2) – (0.2) (6.5) – (1.0) (4.3) – 1.6 (3.5) – 3.1 (2.9) – 0.3 3.1 – 7.4 (1.2) – 1.5
[1] Over the past ten years, reserve re-estimates for total Property & Casualty ranged from (1.2)% to 21.5%. Excluding the reserve strengthening for
asbestos and environmental reserves, over the past ten years reserve re-estimates for total Property & Casualty ranged from (3.0)% to 1.6%.
The potential variability of the Company’ s Property & Casualty reserves would normally be expected to vary by segment and the types
of loss exposures insured by those segments. Illustrative factors influencing the potential reserve variability for each of the segments are
discussed above.


