The Hartford 2009 Annual Report Download - page 106
Download and view the complete annual report
Please find page 106 of the 2009 The Hartford annual report below. You can navigate through the pages in the report by either clicking on the pages listed below, or by using the keyword search tool below to find specific information within the annual report.-
 1
1 -
2
-
3
-
4
-
5
-
6
-
7
-
8
-
9
-
10
-
11
-
12
-
13
-
14
-
15
-
16
-
17
-
18
-
19
-
20
-
21
-
22
-
23
-
24
-
25
-
26
-
27
-
28
-
29
-
30
-
31
-
32
-
33
-
34
-
35
-
36
-
37
-
38
-
39
-
40
-
41
-
42
-
43
-
44
-
45
-
46
-
47
-
48
-
49
-
50
-
51
-
52
-
53
-
54
-
55
-
56
-
57
-
58
-
59
-
60
-
61
-
62
-
63
-
64
-
65
-
66
-
67
-
68
-
69
-
70
-
71
-
72
-
73
-
74
-
75
-
76
-
77
-
78
-
79
-
80
-
81
-
82
-
83
-
84
-
85
-
86
-
87
-
88
-
89
-
90
-
91
-
92
-
93
-
94
-
95
-
 96
96 -
 97
97 -
 98
98 -
 99
99 -
 100
100 -
 101
101 -
 102
102 -
 103
103 -
 104
104 -
 105
105 -
 106
106 -
 107
107 -
 108
108 -
 109
109 -
 110
110 -
 111
111 -
 112
112 -
 113
113 -
 114
114 -
 115
115 -
 116
116 -
117
-
118
-
119
-
120
-
121
-
122
-
123
-
124
-
125
-
126
-
127
-
128
-
129
-
130
-
131
-
132
-
133
-
134
-
135
-
136
-
137
-
138
-
139
-
140
-
141
-
142
-
143
-
144
-
145
-
146
-
147
-
148
-
149
-
150
-
151
-
152
-
153
-
154
-
155
-
156
-
157
-
158
-
159
-
160
-
161
-
162
-
163
-
164
-
165
-
166
-
167
-
168
-
169
-
170
-
171
-
172
-
173
-
174
-
175
-
176
-
177
-
178
-
179
-
180
-
181
-
182
-
183
-
184
-
185
-
186
-
187
-
188
-
189
-
190
-
191
-
192
-
193
-
194
-
195
-
196
-
197
-
198
-
199
-
200
-
201
-
202
-
203
-
204
-
205
-
206
-
207
-
208
-
209
-
210
-
211
-
212
-
213
-
214
-
215
-
216
-
217
-
218
-
219
-
220
-
221
-
222
-
223
-
224
-
225
-
226
-
227
-
228
-
229
-
230
-
231
-
232
-
233
-
234
-
235
-
236
-
237
-
238
-
239
-
240
-
241
-
242
-
243
-
244
-
245
-
246
-
247
-
248
-
249
-
250
-
251
-
252
-
253
-
254
-
255
-
256
-
257
-
258
-
259
-
260
-
261
-
262
-
263
-
264
-
265
-
266
-
267
 |
 |

106
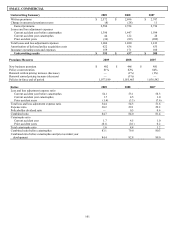
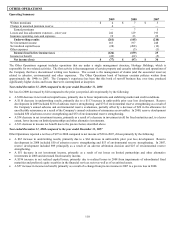
Year ended December 31, 2008 compared to the year ended December 31, 2007
Underwriting results increased by $12 with a corresponding 0.9 point decrease in the combined ratio.
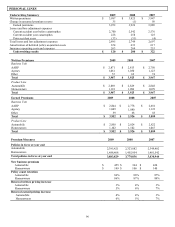
Earned premiums
Earned premiums for the Middle Market segment decreased by $121, or 5%, driven primarily by decreases in commercial auto,
workers’ compensation and general liability. Earned premium decreases were primarily due to a decline in earned pricing in 2008 and
the effect of non-renewals outpacing new business in commercial auto and general liability over the last nine months of 2007 and the
first nine months of 2008, partially offset by the effect of new business written premium outpacing non-renewals in workers’
compensation since the fourth quarter of 2007.
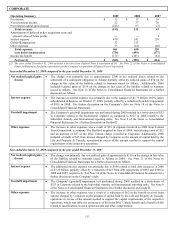
New business
premium
• New business written premium increased by $26, or 7%, in 2008 as an increase in new business written
premium for workers’ compensation was partially offset by a decrease in new business for general liability,
marine and commercial auto. While continued price competition and the effect of some state-mandated rate
reductions in workers' compensation has lessened the attractiveness of new business in certain lines and
regions, the Company has increased new business for workers’ compensation due, in part, to the effect of
targeting business in selected industries and regions of the country.
Policy count
retention
• Policy count retention decreased due largely to a decrease in retention for general liability.
Renewal earned
pricing decrease
• Renewal earned pricing decreased in workers’ compensation, commercial auto, general liability, property
and marine. The earned pricing decreases in 2008 were primarily a reflection of written pricing changes
over the last two years. A number of carriers have continued to compete fairly aggressively on price,
particularly on larger accounts within Middle Market, which has contributed to mid-single digit price
decreases across the industry.
Policies in-force • The number of policies in-force increased by 3%, due largely to growth on smaller accounts.
Losses and loss adjustment expenses
Current accident year losses and loss adjustment expenses before catastrophes
Middle Market current accident year losses and loss adjustment expenses before catastrophes decreased by $101 due largely to a
decrease in earned premium. Before catastrophes, the current accident year loss and loss adjustment expense ratio decreased by 1.0
point, primarily due to a lower loss and loss adjustment expense ratio on workers’ compensation and general liability business, largely
offset by higher non-catastrophe losses on property and marine business and the effect of earned pricing decreases. The higher non-
catastrophe losses on property business were driven by increased severity, including a number of large individual claims, and the higher
non-catastrophe losses on marine business were primarily driven by increased frequency.
Current accident year catastrophes
Current accident year catastrophe losses of $116 in 2008 were higher than current accident year catastrophe losses of $15 in 2007,
primarily due to losses from hurricane Ike and tornadoes and thunderstorms in the South and Midwest.
Prior accident year development
Net favorable prior accident year reserve development increased by $118 in 2008. Net favorable reserve development of $134 in 2008
primarily included a $90 release of reserves for high hazard and umbrella general liability claims, primarily related to the 2001 to 2007
accident years, a $64 release of workers’ compensation reserves, primarily related to accident years 2000 to 2007 and a $27 release of
commercial auto liability reserves, primarily related to accident years 2002 to 2007, partially offset by a $50 strengthening of reserves
for general liability and products liability claims primarily for accident years 2004 and prior.
Net favorable reserve development of $16 in 2007 primarily included a $49 release of general liability loss and loss adjustment expense
reserves for accident years 2003 to 2006 and an $18 release of commercial auto liability reserves for accident years 2003 and 2004,
partially offset by a $40 strengthening of workers’ compensation reserves for accident years 1973 & prior and a $14 strengthening of
general liability reserves for accident years more than 20 years old.
Operating expenses
The $16 decrease in the amortization of deferred policy acquisition costs was largely due to the decrease in earned premium, partially
offset by the amortization of higher underwriting costs. Insurance operating costs and expenses included policyholder dividends of $21
in 2008 and $14 in 2007 which increased primarily due to a $6 increase in the estimated amount of dividends payable to certain
workers’ compensation policyholders due to underwriting profits. Apart from policyholder dividends, insurance operating costs and
expenses decreased by $6 as the effect of lower compensation-related costs was partially offset by higher IT costs and an estimated $3
of TWIA assessments in 2008. The expense ratio increased by 0.5 points due to the amortization of higher underwriting costs, the
TWIA assessments in 2008 and the effect of lower earned premiums, partially offset by the effect of lower compensation-related costs.