The Hartford 2009 Annual Report Download - page 64
Download and view the complete annual report
Please find page 64 of the 2009 The Hartford annual report below. You can navigate through the pages in the report by either clicking on the pages listed below, or by using the keyword search tool below to find specific information within the annual report.-
 1
1 -
2
-
3
-
4
-
5
-
6
-
7
-
8
-
9
-
10
-
11
-
12
-
13
-
14
-
15
-
16
-
17
-
18
-
19
-
20
-
21
-
22
-
23
-
24
-
25
-
26
-
27
-
28
-
29
-
30
-
31
-
32
-
33
-
34
-
35
-
36
-
37
-
38
-
39
-
40
-
41
-
42
-
43
-
44
-
45
-
46
-
47
-
48
-
49
-
50
-
51
-
52
-
53
-
 54
54 -
 55
55 -
 56
56 -
 57
57 -
 58
58 -
 59
59 -
 60
60 -
 61
61 -
 62
62 -
 63
63 -
 64
64 -
 65
65 -
 66
66 -
 67
67 -
 68
68 -
 69
69 -
 70
70 -
 71
71 -
 72
72 -
 73
73 -
 74
74 -
75
-
76
-
77
-
78
-
79
-
80
-
81
-
82
-
83
-
84
-
85
-
86
-
87
-
88
-
89
-
90
-
91
-
92
-
93
-
94
-
95
-
96
-
97
-
98
-
99
-
100
-
101
-
102
-
103
-
104
-
105
-
106
-
107
-
108
-
109
-
110
-
111
-
112
-
113
-
114
-
115
-
116
-
117
-
118
-
119
-
120
-
121
-
122
-
123
-
124
-
125
-
126
-
127
-
128
-
129
-
130
-
131
-
132
-
133
-
134
-
135
-
136
-
137
-
138
-
139
-
140
-
141
-
142
-
143
-
144
-
145
-
146
-
147
-
148
-
149
-
150
-
151
-
152
-
153
-
154
-
155
-
156
-
157
-
158
-
159
-
160
-
161
-
162
-
163
-
164
-
165
-
166
-
167
-
168
-
169
-
170
-
171
-
172
-
173
-
174
-
175
-
176
-
177
-
178
-
179
-
180
-
181
-
182
-
183
-
184
-
185
-
186
-
187
-
188
-
189
-
190
-
191
-
192
-
193
-
194
-
195
-
196
-
197
-
198
-
199
-
200
-
201
-
202
-
203
-
204
-
205
-
206
-
207
-
208
-
209
-
210
-
211
-
212
-
213
-
214
-
215
-
216
-
217
-
218
-
219
-
220
-
221
-
222
-
223
-
224
-
225
-
226
-
227
-
228
-
229
-
230
-
231
-
232
-
233
-
234
-
235
-
236
-
237
-
238
-
239
-
240
-
241
-
242
-
243
-
244
-
245
-
246
-
247
-
248
-
249
-
250
-
251
-
252
-
253
-
254
-
255
-
256
-
257
-
258
-
259
-
260
-
261
-
262
-
263
-
264
-
265
-
266
-
267
 |
 |

64
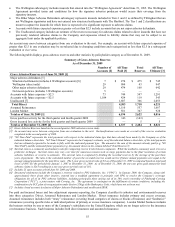
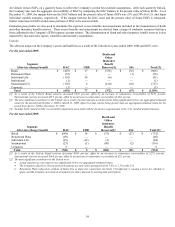
The Company has analyzed the third-party pricing services valuation methodologies and related inputs, and has also evaluated the
various types of securities in its investment portfolio to determine an appropriate fair value hierarchy level based upon trading activity
and the observability of market inputs. For further discussion of fair value measurement, see Note 4 of the Notes to Consolidated
Financial Statements.
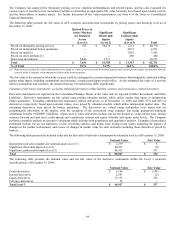
The following table presents the fair value of AFS securities and short-term investments by pricing source and hierarchy level as of
December 31, 2009.
Quoted Prices in
Active Markets
for Identical
Assets
(Level 1)
Significant
Observable
Inputs
(Level 2)
Significant
Unobservable
Inputs
(Level 3)
Total
Priced via third-party pricing services $ 785 $ 58,274 $ 1,711 $ 60,770
Priced via independent broker quotations — — 4,071 4,071
Priced via matrices — — 7,053 7,053
Priced via other methods [1] — — 480 480
Short-term investments 6,846 3,511 — 10,357
Total $ 7,631 $ 61,785 $ 13,315 $ 82,731
% of Total 9.2% 74.7% 16.1% 100.0%
[1] Represents securities for which adjustments were made to reduce prices received from third parties and certain private equity investments that are
carried at the Company’s determination of fair value from inception.
The fair value is the amount at which the security could be exchanged in a current transaction between knowledgeable, unrelated willing
parties using inputs, including assumptions and estimates, a market participant would utilize. As the estimated fair value of a security
utilizes assumptions and estimates, the amount that may be realized may differ significantly.
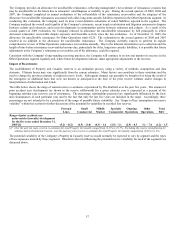
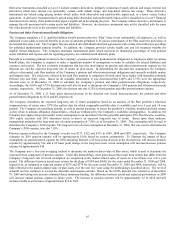
Valuation of Derivative Instruments, excluding embedded derivatives within liability contracts and reinsurance related derivatives
Derivative instruments are reported on the Consolidated Balance Sheets at fair value and are reported in Other Investments and Other
Liabilities. Derivative instruments are fair valued using pricing valuation models, which utilize market data inputs or independent
broker quotations. Excluding embedded and reinsurance related derivatives, as of December 31, 2009 and 2008, 97% and 94% of
derivatives, respectively, based upon notional values, were priced by valuation models, which utilize independent market data. The
remaining derivatives were priced by broker quotations. The derivatives are valued using mid-market level inputs that are
predominantly observable in the market, with the exception of the customized swap contracts that hedge guaranteed minimum
withdrawal benefits (“GMWB”) liabilities. Inputs used to value derivatives include, but are not limited to, swap interest rates, foreign
currency forward and spot rates, credit spreads and correlations, interest and equity volatility and equity index levels. The Company
performs a monthly analysis on derivative valuations which includes both quantitative and qualitative analysis. Examples of procedures
performed include, but are not limited to, review of pricing statistics and trends, back testing recent trades, analyzing the impacts of
changes in the market environment, and review of changes in market value for each derivative including those derivatives priced by
brokers.
The following table presents the notional value and net fair value of derivative instruments by hierarchy level as of December 31, 2009.
Notional Value Fair Value
Quoted prices in active markets for identical assets (Level 1) $ 2,279 $ 6
Significant observable inputs (Level 2) 40,871 (9)
Significant unobservable inputs (Level 3) 44,917 337
Total $ 88,067 $ 334
The following table presents the notional value and net fair value of the derivative instruments within the Level 3 securities
classification as of December 31, 2009.
Notional Value Fair Value
Credit derivatives $ 5,166 $ (193)
Interest derivatives 2,591 (2)
Equity derivatives 37,135 532
Currency derivatives 25 —
Total Level 3 $ 44,917 $ 337