The Hartford 2009 Annual Report Download - page 75
Download and view the complete annual report
Please find page 75 of the 2009 The Hartford annual report below. You can navigate through the pages in the report by either clicking on the pages listed below, or by using the keyword search tool below to find specific information within the annual report.-
 1
1 -
2
-
3
-
4
-
5
-
6
-
7
-
8
-
9
-
10
-
11
-
12
-
13
-
14
-
15
-
16
-
17
-
18
-
19
-
20
-
21
-
22
-
23
-
24
-
25
-
26
-
27
-
28
-
29
-
30
-
31
-
32
-
33
-
34
-
35
-
36
-
37
-
38
-
39
-
40
-
41
-
42
-
43
-
44
-
45
-
46
-
47
-
48
-
49
-
50
-
51
-
52
-
53
-
54
-
55
-
56
-
57
-
58
-
59
-
60
-
61
-
62
-
63
-
64
-
 65
65 -
 66
66 -
 67
67 -
 68
68 -
 69
69 -
 70
70 -
 71
71 -
 72
72 -
 73
73 -
 74
74 -
 75
75 -
 76
76 -
 77
77 -
 78
78 -
 79
79 -
 80
80 -
 81
81 -
 82
82 -
 83
83 -
 84
84 -
 85
85 -
86
-
87
-
88
-
89
-
90
-
91
-
92
-
93
-
94
-
95
-
96
-
97
-
98
-
99
-
100
-
101
-
102
-
103
-
104
-
105
-
106
-
107
-
108
-
109
-
110
-
111
-
112
-
113
-
114
-
115
-
116
-
117
-
118
-
119
-
120
-
121
-
122
-
123
-
124
-
125
-
126
-
127
-
128
-
129
-
130
-
131
-
132
-
133
-
134
-
135
-
136
-
137
-
138
-
139
-
140
-
141
-
142
-
143
-
144
-
145
-
146
-
147
-
148
-
149
-
150
-
151
-
152
-
153
-
154
-
155
-
156
-
157
-
158
-
159
-
160
-
161
-
162
-
163
-
164
-
165
-
166
-
167
-
168
-
169
-
170
-
171
-
172
-
173
-
174
-
175
-
176
-
177
-
178
-
179
-
180
-
181
-
182
-
183
-
184
-
185
-
186
-
187
-
188
-
189
-
190
-
191
-
192
-
193
-
194
-
195
-
196
-
197
-
198
-
199
-
200
-
201
-
202
-
203
-
204
-
205
-
206
-
207
-
208
-
209
-
210
-
211
-
212
-
213
-
214
-
215
-
216
-
217
-
218
-
219
-
220
-
221
-
222
-
223
-
224
-
225
-
226
-
227
-
228
-
229
-
230
-
231
-
232
-
233
-
234
-
235
-
236
-
237
-
238
-
239
-
240
-
241
-
242
-
243
-
244
-
245
-
246
-
247
-
248
-
249
-
250
-
251
-
252
-
253
-
254
-
255
-
256
-
257
-
258
-
259
-
260
-
261
-
262
-
263
-
264
-
265
-
266
-
267
 |
 |

75
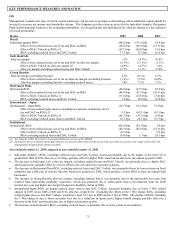
Property & Casualty
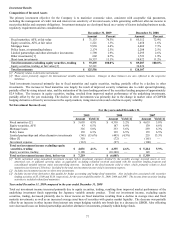
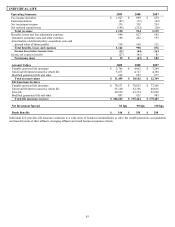
The Company considers several measures and ratios to be the key performance indicators for the property and casualty underwriting
businesses. The following table and the segment discussions include the more significant ratios and measures of profitability for the
years ended December 31, 2009, 2008 and 2007. Management believes that these ratios and measures are useful in understanding the
underlying trends in The Hartford’ s property and casualty insurance underwriting business. However, these key performance indicators
should only be used in conjunction with, and not in lieu of, underwriting income for the underwriting segments of Personal Lines, Small
Commercial, Middle Market and Specialty Commercial and net income for the Property & Casualty business as a whole, Ongoing
Operations and Other Operations. These ratios and measures may not be comparable to other performance measures used by the
Company’ s competitors.
Ongoing Operations earned premium growth 2009 2008 2007
Personal Lines 1% 1% 3%
Small Commercial (5%) — 3%
Middle Market (9%) (5%) (4%)
Specialty Commercial (11%) (4%) (3%)
Total Ongoing Operations (5%) (2%) 1%
Ongoing Operations combined ratio
Combined ratio before catastrophes and prior year development 91.7 88.9 90.5
Catastrophe ratio
Current year 3.1 5.3 1.7
Prior years (0.2) (0.2) 0.1
Total catastrophe ratio 2.9 5.0 1.8
Non-catastrophe prior year development (4.2) (3.2) (1.5)
Combined ratio 90.4 90.7 90.8
Other Operations net income (loss) $ (77) $ (97) $ 30
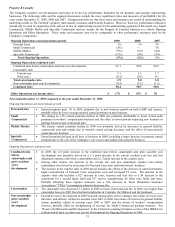
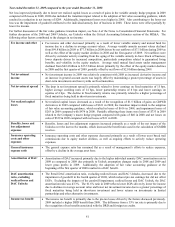
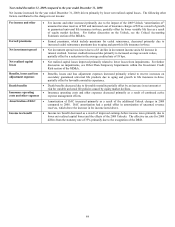
Year ended December 31, 2009 compared to the year ended December 31, 2008
Ongoing Operations earned premium growth
Personal Lines • Earned premium grew 1% in 2009, primarily due to new business growth on both AARP and Agency,
partially offset by lower average renewal earned premium on auto business.
Small
Commercial
• The change to a 5% earned premium decline in 2009 was primarily attributable to lower earned audit
premium on workers’ compensation business and the effect of non-renewals outpacing new business in
package business and commercial auto.
Middle Market • The steeper earned premium decline in 2009 was primarily driven by decreases in general liability,
commercial auto and marine due to renewal earned pricing decreases and the effect of non-renewals
outpacing new business.
Specialty
Commercial
• Earned premium declined in all lines of business in 2009, including a larger decrease in property earned
premium due to the sale of the Company’ s core excess and surplus lines property business.
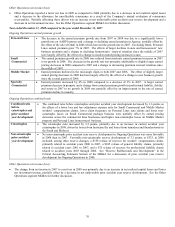
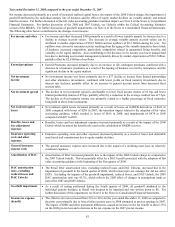
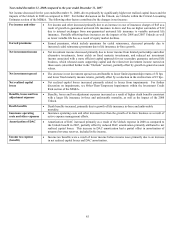
Ongoing Operations combined ratio
Combined ratio
before
catastrophes and
prior accident
years
development
• In 2009, the 2.8 point increase in the combined ratio before catastrophes and prior accident year
development was primarily driven by a 1.9 point increase in the current accident year loss and loss
adjustment expense ratio before catastrophes and a 1.2 point increase in the expense ratio.
• Among other factors, the increase in the current loss and loss adjustment expense ratio before
catastrophes was driven by an increase for Personal Lines auto and homeowners’ business.
• The increase in the expense ratio in 2009 period includes the effects of the decrease in earned premiums,
higher amortization of Personal Lines acquisition costs and increased IT costs. The increase in the
expense ratio also includes a $23 increase in taxes, licenses and fees due to a $6 increase in the
assessment for a second injury fund and $17 reserve strengthening for other state funds and taxes.
Partially offsetting these expense increases was a $34 decrease in Texas Windstorm Insurance
Association (“TWIA”) assessments related to hurricane Ike.
Catastrophes • The catastrophe ratio decreased 2.1 points in 2009 as losses from hurricane Ike in 2008 were higher than
catastrophe losses in 2009 from hail and windstorms in Colorado, the Midwest and the Southeast.
Non-catastrophe
prior accident
years
development
• Favorable reserve development in 2009 included, among other reserve changes, the release of reserves for
directors’ and officers’ claims for accident years 2003 to 2008, the release of reserves for general liability
claims, primarily related to accident years 2003 to 2007, and the release of workers’ compensation
reserves, partially offset by strengthening of reserves for Small Commercial package business. See
“Reserve Rollforwards and Development” in the Critical Accounting Estimates section of the MD&A for
a discussion of prior accident year reserve development for Ongoing Operations in 2009.