The Hartford 2009 Annual Report Download - page 94
Download and view the complete annual report
Please find page 94 of the 2009 The Hartford annual report below. You can navigate through the pages in the report by either clicking on the pages listed below, or by using the keyword search tool below to find specific information within the annual report.-
 1
1 -
2
-
3
-
4
-
5
-
6
-
7
-
8
-
9
-
10
-
11
-
12
-
13
-
14
-
15
-
16
-
17
-
18
-
19
-
20
-
21
-
22
-
23
-
24
-
25
-
26
-
27
-
28
-
29
-
30
-
31
-
32
-
33
-
34
-
35
-
36
-
37
-
38
-
39
-
40
-
41
-
42
-
43
-
44
-
45
-
46
-
47
-
48
-
49
-
50
-
51
-
52
-
53
-
54
-
55
-
56
-
57
-
58
-
59
-
60
-
61
-
62
-
63
-
64
-
65
-
66
-
67
-
68
-
69
-
70
-
71
-
72
-
73
-
74
-
75
-
76
-
77
-
78
-
79
-
80
-
81
-
82
-
83
-
 84
84 -
 85
85 -
 86
86 -
 87
87 -
 88
88 -
 89
89 -
 90
90 -
 91
91 -
 92
92 -
 93
93 -
 94
94 -
 95
95 -
 96
96 -
 97
97 -
 98
98 -
 99
99 -
 100
100 -
 101
101 -
 102
102 -
 103
103 -
 104
104 -
105
-
106
-
107
-
108
-
109
-
110
-
111
-
112
-
113
-
114
-
115
-
116
-
117
-
118
-
119
-
120
-
121
-
122
-
123
-
124
-
125
-
126
-
127
-
128
-
129
-
130
-
131
-
132
-
133
-
134
-
135
-
136
-
137
-
138
-
139
-
140
-
141
-
142
-
143
-
144
-
145
-
146
-
147
-
148
-
149
-
150
-
151
-
152
-
153
-
154
-
155
-
156
-
157
-
158
-
159
-
160
-
161
-
162
-
163
-
164
-
165
-
166
-
167
-
168
-
169
-
170
-
171
-
172
-
173
-
174
-
175
-
176
-
177
-
178
-
179
-
180
-
181
-
182
-
183
-
184
-
185
-
186
-
187
-
188
-
189
-
190
-
191
-
192
-
193
-
194
-
195
-
196
-
197
-
198
-
199
-
200
-
201
-
202
-
203
-
204
-
205
-
206
-
207
-
208
-
209
-
210
-
211
-
212
-
213
-
214
-
215
-
216
-
217
-
218
-
219
-
220
-
221
-
222
-
223
-
224
-
225
-
226
-
227
-
228
-
229
-
230
-
231
-
232
-
233
-
234
-
235
-
236
-
237
-
238
-
239
-
240
-
241
-
242
-
243
-
244
-
245
-
246
-
247
-
248
-
249
-
250
-
251
-
252
-
253
-
254
-
255
-
256
-
257
-
258
-
259
-
260
-
261
-
262
-
263
-
264
-
265
-
266
-
267
 |
 |

94
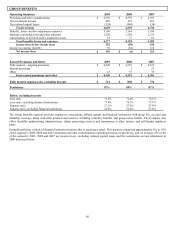
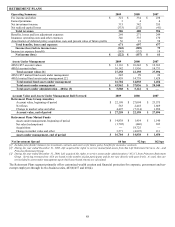
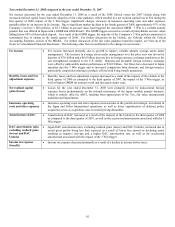
Benefits, losses and
loss adjustment
expenses
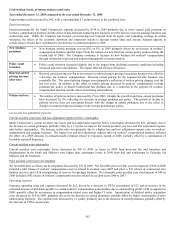
• Benefits, losses and loss adjustment expenses were lower driven by lower interest credited due to
lower rates on floating rate GIP’ s as well as an overall smaller block of business.
Insurance operating
costs and expenses and
general insurance
expense ratio
• Insurance operating costs and other expenses decreased due to active expense management efforts and
reduced information technology expenses.
Income tax benefit • The income tax benefit was flat due to flat income before taxes.
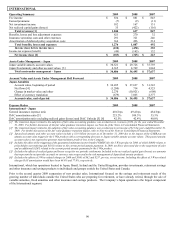
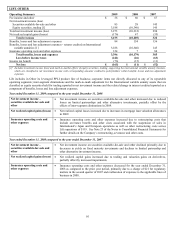
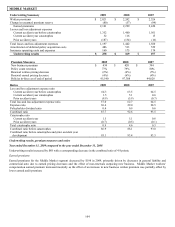
Year ended December 31, 2008 compared to the year ended December 31, 2007
Net income in Institutional decreased primarily due to increased net realized capital losses and lower net investment income. The
following other factors contributed to changes in net income:
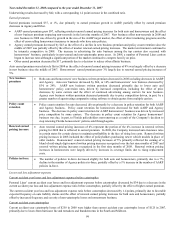
Fee income and other • Fee income and other decreased primarily due to lower front-end loads on private placement life
insurance (“PPLI”) cases during 2008. PPLI collects front-end loads recorded in fee income, offset by
corresponding premium taxes reported in insurance operating costs and other expenses. For 2008 and
2007, PPLI deposits of $247 and $5.2 billion, respectively, resulted in fee income due to front-end loads
of $2 and $107, respectively.
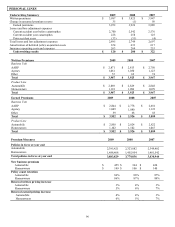
Earned premiums • Earned premiums decreased as compared to the prior year due to greater amounts of life contingent
business sold in 2007. The decrease in earned premiums was offset by a corresponding decrease in
benefits, losses, and loss adjustment expenses.
Net investment income • Net investment income declined due to losses from limited partnership and other alternative investments
of $(127), lower yields on fixed maturity investments indexed to LIBOR, and lower assets under
management. The decline in yield on fixed maturities was largely offset by a corresponding decrease in
interest credited on liabilities reported in benefits, losses, and loss adjustment expense. Assets under
management decreased primarily due to stable value outflows.
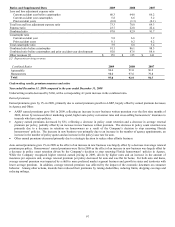
Net investment spread • Stable Value, net investment spreads were negatively impacted by 158 bps due to lower yields on
variable rate securities and maintaining additional liquidity in the Institutional portfolios in the form of
short-term investments and U.S. Treasuries, and 55 bps attributable to negative limited partnership
returns. In both periods, the drop in variable rate yields was partially offset by lower credited rates on
floating rate liabilities.
Net realized capital
losses
• Net realized capital losses were higher due to significant impairments.
Benefits, losses and
loss adjustment
expenses
• Benefits, losses and loss adjustment expenses decreased primarily due to lower reserve increases as the
result of lower sales in life contingent business, as well as lower interest credited on liabilities indexed
to LIBOR. The decrease was partially offset by an increase in mortality losses of $8.
Insurance operating
costs and expenses and
general insurance
expense ratio
• Insurance operating costs and other expenses decreased due to a decline in premium tax, driven by
reduced PPLI deposits, partially offset by discontinued administrative system projects and product
development expenses.
Income tax benefit • The income tax benefit increased compared to the prior year primarily due to a decline in income before
taxes primarily due to increased realized capital losses.