The Hartford 2009 Annual Report Download - page 72
Download and view the complete annual report
Please find page 72 of the 2009 The Hartford annual report below. You can navigate through the pages in the report by either clicking on the pages listed below, or by using the keyword search tool below to find specific information within the annual report.-
 1
1 -
2
-
3
-
4
-
5
-
6
-
7
-
8
-
9
-
10
-
11
-
12
-
13
-
14
-
15
-
16
-
17
-
18
-
19
-
20
-
21
-
22
-
23
-
24
-
25
-
26
-
27
-
28
-
29
-
30
-
31
-
32
-
33
-
34
-
35
-
36
-
37
-
38
-
39
-
40
-
41
-
42
-
43
-
44
-
45
-
46
-
47
-
48
-
49
-
50
-
51
-
52
-
53
-
54
-
55
-
56
-
57
-
58
-
59
-
60
-
61
-
 62
62 -
 63
63 -
 64
64 -
 65
65 -
 66
66 -
 67
67 -
 68
68 -
 69
69 -
 70
70 -
 71
71 -
 72
72 -
 73
73 -
 74
74 -
 75
75 -
 76
76 -
 77
77 -
 78
78 -
 79
79 -
 80
80 -
 81
81 -
 82
82 -
83
-
84
-
85
-
86
-
87
-
88
-
89
-
90
-
91
-
92
-
93
-
94
-
95
-
96
-
97
-
98
-
99
-
100
-
101
-
102
-
103
-
104
-
105
-
106
-
107
-
108
-
109
-
110
-
111
-
112
-
113
-
114
-
115
-
116
-
117
-
118
-
119
-
120
-
121
-
122
-
123
-
124
-
125
-
126
-
127
-
128
-
129
-
130
-
131
-
132
-
133
-
134
-
135
-
136
-
137
-
138
-
139
-
140
-
141
-
142
-
143
-
144
-
145
-
146
-
147
-
148
-
149
-
150
-
151
-
152
-
153
-
154
-
155
-
156
-
157
-
158
-
159
-
160
-
161
-
162
-
163
-
164
-
165
-
166
-
167
-
168
-
169
-
170
-
171
-
172
-
173
-
174
-
175
-
176
-
177
-
178
-
179
-
180
-
181
-
182
-
183
-
184
-
185
-
186
-
187
-
188
-
189
-
190
-
191
-
192
-
193
-
194
-
195
-
196
-
197
-
198
-
199
-
200
-
201
-
202
-
203
-
204
-
205
-
206
-
207
-
208
-
209
-
210
-
211
-
212
-
213
-
214
-
215
-
216
-
217
-
218
-
219
-
220
-
221
-
222
-
223
-
224
-
225
-
226
-
227
-
228
-
229
-
230
-
231
-
232
-
233
-
234
-
235
-
236
-
237
-
238
-
239
-
240
-
241
-
242
-
243
-
244
-
245
-
246
-
247
-
248
-
249
-
250
-
251
-
252
-
253
-
254
-
255
-
256
-
257
-
258
-
259
-
260
-
261
-
262
-
263
-
264
-
265
-
266
-
267
 |
 |
72
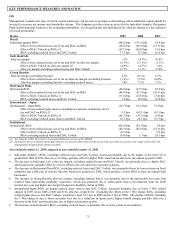
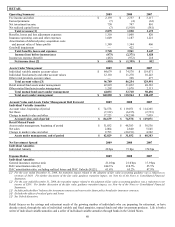
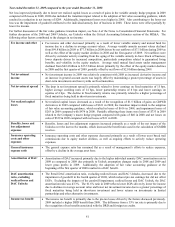
Combined ratio before catastrophes and prior accident year development
The combined ratio before catastrophes and prior accident year development represents the combined ratio for the current accident year,
excluding the impact of catastrophes. The Company believes this ratio is an important measure of the trend in profitability since it
removes the impact of volatile and unpredictable catastrophe losses and prior accident year reserve development.
Underwriting results
Underwriting results is a before-tax measure that represents earned premiums less incurred losses, loss adjustment expenses,
underwriting expenses and policyholder dividends. The Hartford believes that underwriting results provides investors with a valuable
measure of before-tax profitability derived from underwriting activities, which are managed separately from the Company’ s investing
activities. Within Ongoing Operations, the underwriting segments of Personal Lines, Small Commercial, Middle Market and Specialty
Commercial are evaluated by management primarily based upon underwriting results. Underwriting results is also presented for
Ongoing Operations and Other Operations. A reconciliation of underwriting results to net income for Ongoing Operations and Other
Operations is set forth in their respective discussions herein.
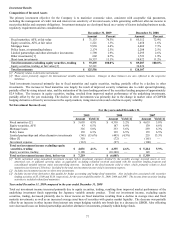
Investment yield
The investment yield, or return, on the Company’ s invested assets primarily includes interest income on fixed maturity investments.
Based upon the fair value of Property & Casualty’ s investments as of December 31, 2009 and 2008, approximately 87% and 82%,
respectively, of invested assets were held in fixed maturities. A number of factors affect the yield on fixed maturity investments,
including fluctuations in interest rates and the level of principal prepayments. The Company also invests in equity securities, mortgage
loans, limited partnership arrangements and other alternative investments. Total Property & Casualty investment yield, after-tax, was
3.1%, 3.2% and 4.4% for the years ended December 31, 2009, 2008 and 2007, respectively.