The Hartford 2009 Annual Report Download - page 130
Download and view the complete annual report
Please find page 130 of the 2009 The Hartford annual report below. You can navigate through the pages in the report by either clicking on the pages listed below, or by using the keyword search tool below to find specific information within the annual report.-
 1
1 -
2
-
3
-
4
-
5
-
6
-
7
-
8
-
9
-
10
-
11
-
12
-
13
-
14
-
15
-
16
-
17
-
18
-
19
-
20
-
21
-
22
-
23
-
24
-
25
-
26
-
27
-
28
-
29
-
30
-
31
-
32
-
33
-
34
-
35
-
36
-
37
-
38
-
39
-
40
-
41
-
42
-
43
-
44
-
45
-
46
-
47
-
48
-
49
-
50
-
51
-
52
-
53
-
54
-
55
-
56
-
57
-
58
-
59
-
60
-
61
-
62
-
63
-
64
-
65
-
66
-
67
-
68
-
69
-
70
-
71
-
72
-
73
-
74
-
75
-
76
-
77
-
78
-
79
-
80
-
81
-
82
-
83
-
84
-
85
-
86
-
87
-
88
-
89
-
90
-
91
-
92
-
93
-
94
-
95
-
96
-
97
-
98
-
99
-
100
-
101
-
102
-
103
-
104
-
105
-
106
-
107
-
108
-
109
-
110
-
111
-
112
-
113
-
114
-
115
-
116
-
117
-
118
-
119
-
 120
120 -
 121
121 -
 122
122 -
 123
123 -
 124
124 -
 125
125 -
 126
126 -
 127
127 -
 128
128 -
 129
129 -
 130
130 -
 131
131 -
 132
132 -
 133
133 -
 134
134 -
 135
135 -
 136
136 -
 137
137 -
 138
138 -
 139
139 -
 140
140 -
141
-
142
-
143
-
144
-
145
-
146
-
147
-
148
-
149
-
150
-
151
-
152
-
153
-
154
-
155
-
156
-
157
-
158
-
159
-
160
-
161
-
162
-
163
-
164
-
165
-
166
-
167
-
168
-
169
-
170
-
171
-
172
-
173
-
174
-
175
-
176
-
177
-
178
-
179
-
180
-
181
-
182
-
183
-
184
-
185
-
186
-
187
-
188
-
189
-
190
-
191
-
192
-
193
-
194
-
195
-
196
-
197
-
198
-
199
-
200
-
201
-
202
-
203
-
204
-
205
-
206
-
207
-
208
-
209
-
210
-
211
-
212
-
213
-
214
-
215
-
216
-
217
-
218
-
219
-
220
-
221
-
222
-
223
-
224
-
225
-
226
-
227
-
228
-
229
-
230
-
231
-
232
-
233
-
234
-
235
-
236
-
237
-
238
-
239
-
240
-
241
-
242
-
243
-
244
-
245
-
246
-
247
-
248
-
249
-
250
-
251
-
252
-
253
-
254
-
255
-
256
-
257
-
258
-
259
-
260
-
261
-
262
-
263
-
264
-
265
-
266
-
267
 |
 |

130
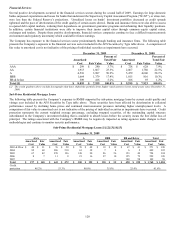
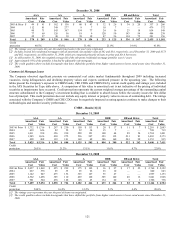
The Company is also exposed to credit spread risk related to security market price and cash flows associated with changes in credit
spreads. Credit spread widening will reduce the fair value of the investment portfolio and will increase net investment income on new
purchases. If issuer credit spreads increase significantly or for an extended period of time, it may result in higher impairment losses.
Credit spread tightening will reduce net investment income associated with new purchases of fixed maturities and increase the fair value
of the investment portfolio. For further discussion of sectors most significantly impacted, see the Investment Credit Risk section of the
MD&A. Also, for a discussion of the movement of credit spread impacts on the Company’ s statutory financial results as it relates to the
accounting and reporting for market value fixed annuities, see the Capital Resources & Liquidity section of the MD&A.
Equity Risk
The Company does not have significant equity risk exposure from invested assets. The Company’ s primary exposure to equity risk
relates to the potential for lower earnings associated with certain of the Life’ s businesses such as variable annuities where fee income is
earned based upon the fair value of the assets under management. During 2009, Life’ s fee income declined $555 or 11%. In addition,
Life offers certain guaranteed benefits, primarily associated with variable annuity products, which increases the Company’ s potential
benefit exposure as the equity markets decline.
The Company is also subject to equity risk based upon the assets that support its pension plans. The asset allocation mix is reviewed on
a periodic basis. In order to minimize risk, the pension plans maintain a listing of permissible and prohibited investments. In addition,
the pension plans have certain concentration limits and investment quality requirements imposed on permissible investment options. For
further discussion of equity risk associated with the pension plans, see Pension and Other Postretirement Benefit Obligations within the
Critical Accounting Estimates section of the MD&A and Note 17 of the Notes to Consolidated Financial Statements.
Foreign Currency Exchange Risk
The Company’ s foreign currency exchange risk is related to non–U.S. dollar denominated investments, which primarily consist of fixed
maturity investments, the investment in and net income of the Japanese Life and U.K. Life operations, and non-U.S. dollar denominated
liability contracts, including its GMDB, GMAB, GMWB and GMIB benefits associated with its Japanese and U.K. variable annuities,
and a yen denominated individual fixed annuity product. A portion of the Company’ s foreign currency exposure is mitigated through
the use of derivatives.
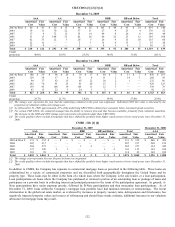
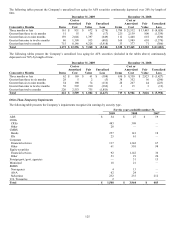
Fixed Maturity Investments
The risk associated with the non-U.S. dollar denominated fixed maturities relates to potential decreases in value and income resulting
from unfavorable changes in foreign exchange rates. The fair value of the non-U.S. dollar denominated fixed maturities, which are
primarily denominated in euro, sterling, yen and Canadian dollars, at December 31, 2009 and 2008, were approximately $1.2 billion and
$3.8 billion, respectively.
In order to manage its currency exposures, the Company enters into foreign currency swaps and forwards to hedge the variability in cash
flows associated with certain foreign denominated fixed maturities. These foreign currency swap and forward agreements are structured
to match the foreign currency cash flows of the hedged foreign denominated securities. At December 31, 2009 and 2008, the derivatives
used to hedge currency exchange risk related to non-U.S. dollar denominated fixed maturities had a total notional amount of $480 and
$1.6 billion, respectively, and total fair value of $(26) and $39, respectively.
Based on the fair values of the Company’ s non-U.S. dollar denominated securities and derivative instruments as of December 31, 2009
and 2008, management estimates that a 10% unfavorable change in exchange rates would decrease the fair values by a before-tax total
of approximately $62 and $205, respectively. The estimated impact was based upon a 10% change in December 31 spot rates. The
selection of the 10% unfavorable change was made only for illustration of the potential hypothetical impact of such an event and should
not be construed as a prediction of future market events. Actual results could differ materially from those illustrated above due to the
nature of the estimates and assumptions used in the above analysis.
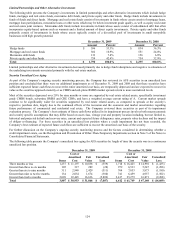
Liabilities
The Company’ s Life operations issued non-U.S. dollar denominated funding agreement liability contracts. The Company hedges the
foreign currency risk associated with these liability contracts with currency rate swaps. At December 31, 2009 and 2008, the derivatives
used to hedge foreign currency exchange risk related to foreign denominated liability contracts had a total notional amount of $814 and
$820, respectively, and a total fair value of $(2) and $(76), respectively.
The Company enters into foreign currency forward and option contracts that convert euros to yen in order to economically hedge the
foreign currency risk associated with certain Japanese variable annuity products. As of December 31, 2009 and 2008, the derivatives
used to hedge foreign currency risk associated with Japanese variable annuity products had a total notional amount of $257 and $259,
respectively, and a total fair value of ($8) and $35, respectively.