The Hartford 2009 Annual Report Download - page 62
Download and view the complete annual report
Please find page 62 of the 2009 The Hartford annual report below. You can navigate through the pages in the report by either clicking on the pages listed below, or by using the keyword search tool below to find specific information within the annual report.-
 1
1 -
2
-
3
-
4
-
5
-
6
-
7
-
8
-
9
-
10
-
11
-
12
-
13
-
14
-
15
-
16
-
17
-
18
-
19
-
20
-
21
-
22
-
23
-
24
-
25
-
26
-
27
-
28
-
29
-
30
-
31
-
32
-
33
-
34
-
35
-
36
-
37
-
38
-
39
-
40
-
41
-
42
-
43
-
44
-
45
-
46
-
47
-
48
-
49
-
50
-
51
-
 52
52 -
 53
53 -
 54
54 -
 55
55 -
 56
56 -
 57
57 -
 58
58 -
 59
59 -
 60
60 -
 61
61 -
 62
62 -
 63
63 -
 64
64 -
 65
65 -
 66
66 -
 67
67 -
 68
68 -
 69
69 -
 70
70 -
 71
71 -
 72
72 -
73
-
74
-
75
-
76
-
77
-
78
-
79
-
80
-
81
-
82
-
83
-
84
-
85
-
86
-
87
-
88
-
89
-
90
-
91
-
92
-
93
-
94
-
95
-
96
-
97
-
98
-
99
-
100
-
101
-
102
-
103
-
104
-
105
-
106
-
107
-
108
-
109
-
110
-
111
-
112
-
113
-
114
-
115
-
116
-
117
-
118
-
119
-
120
-
121
-
122
-
123
-
124
-
125
-
126
-
127
-
128
-
129
-
130
-
131
-
132
-
133
-
134
-
135
-
136
-
137
-
138
-
139
-
140
-
141
-
142
-
143
-
144
-
145
-
146
-
147
-
148
-
149
-
150
-
151
-
152
-
153
-
154
-
155
-
156
-
157
-
158
-
159
-
160
-
161
-
162
-
163
-
164
-
165
-
166
-
167
-
168
-
169
-
170
-
171
-
172
-
173
-
174
-
175
-
176
-
177
-
178
-
179
-
180
-
181
-
182
-
183
-
184
-
185
-
186
-
187
-
188
-
189
-
190
-
191
-
192
-
193
-
194
-
195
-
196
-
197
-
198
-
199
-
200
-
201
-
202
-
203
-
204
-
205
-
206
-
207
-
208
-
209
-
210
-
211
-
212
-
213
-
214
-
215
-
216
-
217
-
218
-
219
-
220
-
221
-
222
-
223
-
224
-
225
-
226
-
227
-
228
-
229
-
230
-
231
-
232
-
233
-
234
-
235
-
236
-
237
-
238
-
239
-
240
-
241
-
242
-
243
-
244
-
245
-
246
-
247
-
248
-
249
-
250
-
251
-
252
-
253
-
254
-
255
-
256
-
257
-
258
-
259
-
260
-
261
-
262
-
263
-
264
-
265
-
266
-
267
 |
 |

62
Margins
The behavior risk margin adds a margin that market participants would require for the risk that the Company’ s assumptions about
policyholder behavior could differ from actual experience. The behavior risk margin is calculated by taking the difference between
adverse policyholder behavior assumptions and best estimate assumptions. During 2009 and 2008, the Company revised certain adverse
assumptions in the behavior risk margin for withdrawals, lapses and annuitization behavior as emerging policyholder behavior
experience suggested the prior adverse policyholder behavior assumptions were no longer representative of an appropriate margin for
risk.
Assumption updates, including policyholder behavior assumptions, affected best estimates and margins for a total realized gain pre-tax
of $566 and $470 for the years ended December 31, 2009 and 2008, respectively. For the year ended December 31, 2007, these updates
affected best estimates resulting in a pre-tax realized loss of $(158).
For additional information on the Company’ s GMWB liability, see Equity Risk within the Capital Markets Risk Management section of
MD&A for additional sensitivities.
In addition to the non-market-based updates described above, for the twelve months ended December 31, 2009, 2008, and 2007, the
Company recognized non-market-based updates driven by the relative outperformance (underperformance) of the underlying actively
managed funds as compared to their respective indices resulting in a gain (loss) of approximately $550, $(355), and $(2), respectively.
Goodwill Impairment
Goodwill balances are reviewed for impairment at least annually or more frequently if events occur or circumstances change that would
indicate that a triggering event has occurred. A reporting unit is defined as an operating segment or one level below an operating
segment. Most of the Company’ s reporting units, for which goodwill has been allocated, are equivalent to the Company’ s operating
segments as there is no discrete financial information available for the separate components of the segment or all of the components of
the segment have similar economic characteristics. The 401(k), 457 and 403(b) components of Retirement Plans have been aggregated
into one reporting unit; the variable life, universal life and term life components of Individual Life have been aggregated into one
reporting unit; the private placement life insurance and institutional investment products components of the Institutional Solutions
Group have been aggregated into one reporting unit; the group disability and group life components of Group Benefits have been
aggregated into one reporting unit; and the homeowners and automobile components of Personal Lines have been aggregated into one
reporting unit. In circumstances where the components of an operating segment constitute a business for which discrete financial
information is available and segment management regularly reviews the operating results of that component such as with Other Retail,
which combined with Individual Annuity constitutes the Retail operating segment, Hartford Financial Products, and Federal Trust
Corporation, the Company has classified those components as reporting units.
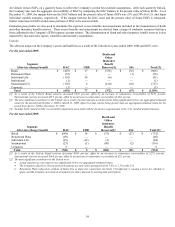
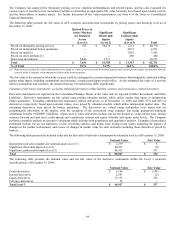
As of December 31, 2009, the Company had goodwill allocated to the following reporting units:
Segment Goodwill Goodwill in Corporate Total
Other Retail $ 159 $ 92 $ 251
Retirement Plans 87 69 156
Individual Life 224 118 342
Group Benefits — 138 138
Personal Lines 119 — 119
Hartford Financial Products within Specialty Commercial 30 — 30
Federal Trust Corporation within Corporate [1] — 168 168
Total $ 619 $ 585 $ 1,204
[1] In 2009, the Company completed the acquisition of Federal Trust Corporation which resulted in additional goodwill of $168 in Corporate.
As of December 31, 2008, the Company had goodwill allocated to the following reporting units:
Segment Goodwill Goodwill in Corporate Total
Other Retail $ 159 $ 92 $ 251
Retirement Plans 79 69 148
Institutional Solutions Group — 32 32
Individual Life 224 118 342
Group Benefits — 138 138
Personal Lines 119 — 119
Hartford Financial Products within Specialty Commercial 30 — 30
Total $ 611 $ 449 $ 1,060
The goodwill impairment test follows a two step process. In the first step, the fair value of a reporting unit is compared to its carrying
value. If the carrying value of a reporting unit exceeds its fair value, the second step of the impairment test is performed for purposes of
measuring the impairment. In the second step, the fair value of the reporting unit is allocated to all of the assets and liabilities of the
reporting unit to determine an implied goodwill value. This allocation is similar to a purchase price allocation performed in purchase
accounting. If the carrying amount of the reporting unit’ s goodwill exceeds the implied goodwill value, an impairment loss shall be
recognized in an amount equal to that excess.