The Hartford 2009 Annual Report Download - page 112
Download and view the complete annual report
Please find page 112 of the 2009 The Hartford annual report below. You can navigate through the pages in the report by either clicking on the pages listed below, or by using the keyword search tool below to find specific information within the annual report.-
 1
1 -
2
-
3
-
4
-
5
-
6
-
7
-
8
-
9
-
10
-
11
-
12
-
13
-
14
-
15
-
16
-
17
-
18
-
19
-
20
-
21
-
22
-
23
-
24
-
25
-
26
-
27
-
28
-
29
-
30
-
31
-
32
-
33
-
34
-
35
-
36
-
37
-
38
-
39
-
40
-
41
-
42
-
43
-
44
-
45
-
46
-
47
-
48
-
49
-
50
-
51
-
52
-
53
-
54
-
55
-
56
-
57
-
58
-
59
-
60
-
61
-
62
-
63
-
64
-
65
-
66
-
67
-
68
-
69
-
70
-
71
-
72
-
73
-
74
-
75
-
76
-
77
-
78
-
79
-
80
-
81
-
82
-
83
-
84
-
85
-
86
-
87
-
88
-
89
-
90
-
91
-
92
-
93
-
94
-
95
-
96
-
97
-
98
-
99
-
100
-
101
-
 102
102 -
 103
103 -
 104
104 -
 105
105 -
 106
106 -
 107
107 -
 108
108 -
 109
109 -
 110
110 -
 111
111 -
 112
112 -
 113
113 -
 114
114 -
 115
115 -
 116
116 -
 117
117 -
 118
118 -
 119
119 -
 120
120 -
 121
121 -
 122
122 -
123
-
124
-
125
-
126
-
127
-
128
-
129
-
130
-
131
-
132
-
133
-
134
-
135
-
136
-
137
-
138
-
139
-
140
-
141
-
142
-
143
-
144
-
145
-
146
-
147
-
148
-
149
-
150
-
151
-
152
-
153
-
154
-
155
-
156
-
157
-
158
-
159
-
160
-
161
-
162
-
163
-
164
-
165
-
166
-
167
-
168
-
169
-
170
-
171
-
172
-
173
-
174
-
175
-
176
-
177
-
178
-
179
-
180
-
181
-
182
-
183
-
184
-
185
-
186
-
187
-
188
-
189
-
190
-
191
-
192
-
193
-
194
-
195
-
196
-
197
-
198
-
199
-
200
-
201
-
202
-
203
-
204
-
205
-
206
-
207
-
208
-
209
-
210
-
211
-
212
-
213
-
214
-
215
-
216
-
217
-
218
-
219
-
220
-
221
-
222
-
223
-
224
-
225
-
226
-
227
-
228
-
229
-
230
-
231
-
232
-
233
-
234
-
235
-
236
-
237
-
238
-
239
-
240
-
241
-
242
-
243
-
244
-
245
-
246
-
247
-
248
-
249
-
250
-
251
-
252
-
253
-
254
-
255
-
256
-
257
-
258
-
259
-
260
-
261
-
262
-
263
-
264
-
265
-
266
-
267
 |
 |

112
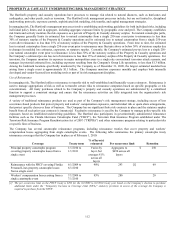
PROPERTY & CASUALTY UNDERWRITING RISK MANAGEMENT STRATEGY
The Hartford's property and casualty operations have processes to manage risk related to natural disasters, such as hurricanes and
earthquakes, and other perils, such as terrorism. The Hartford's risk management processes include, but are not limited to, disciplined
underwriting protocols, exposure controls, sophisticated risk modeling, risk transfer, and capital management strategies.
In managing risk, The Hartford's management processes involve establishing underwriting guidelines for both individual risks, including
individual policy limits, and in aggregate, including aggregate exposure limits by geographic zone and peril. The Company establishes
risk limits and actively monitors the risk exposures as a percent of Property & Casualty statutory surplus. For natural catastrophe perils,
the Company generally limits its estimated loss to natural catastrophes from a single 250-year event prior to reinsurance to less than
30% of statutory surplus of the Property & Casualty operations and its estimated loss to natural catastrophes from a single 250-year
event after reinsurance to less than 15% of statutory surplus of the Property & Casualty operations. From time to time, the estimated
loss to natural catastrophes from a single 250-year event prior to reinsurance may fluctuate above or below 30% of statutory surplus due
to changes in modeled loss estimates, exposures, or statutory surplus. Currently, the Company's estimated pre-tax loss to a single 250-
year natural catastrophe event prior to reinsurance is less than 30% of the statutory surplus of the Property & Casualty operations and
the Company’ s estimated pre-tax loss net of reinsurance is less than 15% of statutory surplus of the Property & Casualty operations. For
terrorism, the Company monitors its exposure in major metropolitan areas to a single-site conventional terrorism attack scenario, and
manages its potential estimated loss, including exposures resulting from the Company's Group Life operations, to less than $1.3 billion.
Among the landmark locations specifically monitored by the Company as of December 31, 2009, the largest estimated modeled loss
arising from a single event is approximately $1.1 billion. The Company monitors exposures monthly and employs both internally
developed and vendor-licensed loss modeling tools as part of its risk management discipline.
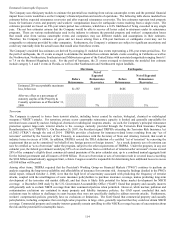
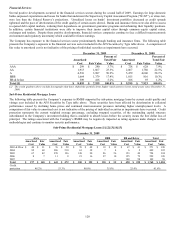
Use of Reinsurance
In managing risk, The Hartford utilizes reinsurance to transfer risk to well-established and financially secure reinsurers. Reinsurance is
used to manage aggregations of risk as well as to transfer certain risks to reinsurance companies based on specific geographic or risk
concentrations. All treaty purchases related to the Company’ s property and casualty operations are administered by a centralized
function to support a consistent strategy and ensure that the reinsurance activities are fully integrated into the organization’ s risk
management processes.
A variety of traditional reinsurance products are used as part of the Company’ s risk management strategy, including excess of loss
occurrence-based products that protect property and workers’ compensation exposures, and individual risk or quota share arrangements,
that protect specific classes or lines of business. The Company has no significant finite risk contracts in place and the statutory surplus
benefit from all such prior year contracts is immaterial. Facultative reinsurance is used by the Company to manage policy-specific risk
exposures based on established underwriting guidelines. The Hartford also participates in governmentally administered reinsurance
facilities such as the Florida Hurricane Catastrophe Fund (“FHCF”), the Terrorism Risk Insurance Program established under The
Terrorism Risk Insurance Program Reauthorization Act of 2007 (“TRIPRA”) and other reinsurance programs relating to particular risks
or specific lines of business.
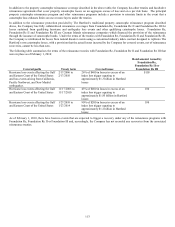
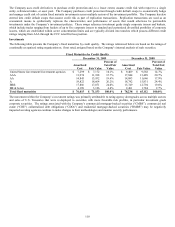
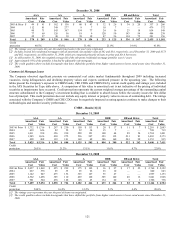
The Company has several catastrophe reinsurance programs, including reinsurance treaties that cover property and workers’
compensation losses aggregating from single catastrophe events. The following table summarizes the primary catastrophe treaty
reinsurance coverages that the Company has in place as of February 1, 2010:
Coverage
Treaty term
% of layer(s)
reinsured
Per occurrence limit
Retention
Principal property catastrophe program
covering property catastrophe losses from a
single event
1/1/2010 to
1/1/2011
Varies by
layer, but
averages 81%
across all
layers
Aggregates to
$690 across all
layers
$250
Reinsurance with the FHCF covering Florida
Personal Lines property catastrophe losses
from a single event
6/1/2009 to
6/1/2010
90% 293 [1] 69
Workers’ compensation losses arising from a
single catastrophe event
7/1/2009 to
7/1/2010
95% 280 20
[1] The per occurrence limit on the FHCF treaty is $293 for the 6/1/2009 to 6/1/2010 treaty year based on the Company’s election to purchase
additional limits under the “Temporary Increase in Coverage Limit (TICL)” statutory provision in excess of the coverage the Company is
required to purchase from the FHCF.