The Hartford 2009 Annual Report Download - page 153
Download and view the complete annual report
Please find page 153 of the 2009 The Hartford annual report below. You can navigate through the pages in the report by either clicking on the pages listed below, or by using the keyword search tool below to find specific information within the annual report.-
 1
1 -
2
-
3
-
4
-
5
-
6
-
7
-
8
-
9
-
10
-
11
-
12
-
13
-
14
-
15
-
16
-
17
-
18
-
19
-
20
-
21
-
22
-
23
-
24
-
25
-
26
-
27
-
28
-
29
-
30
-
31
-
32
-
33
-
34
-
35
-
36
-
37
-
38
-
39
-
40
-
41
-
42
-
43
-
44
-
45
-
46
-
47
-
48
-
49
-
50
-
51
-
52
-
53
-
54
-
55
-
56
-
57
-
58
-
59
-
60
-
61
-
62
-
63
-
64
-
65
-
66
-
67
-
68
-
69
-
70
-
71
-
72
-
73
-
74
-
75
-
76
-
77
-
78
-
79
-
80
-
81
-
82
-
83
-
84
-
85
-
86
-
87
-
88
-
89
-
90
-
91
-
92
-
93
-
94
-
95
-
96
-
97
-
98
-
99
-
100
-
101
-
102
-
103
-
104
-
105
-
106
-
107
-
108
-
109
-
110
-
111
-
112
-
113
-
114
-
115
-
116
-
117
-
118
-
119
-
120
-
121
-
122
-
123
-
124
-
125
-
126
-
127
-
128
-
129
-
130
-
131
-
132
-
133
-
134
-
135
-
136
-
137
-
138
-
139
-
140
-
141
-
142
-
 143
143 -
 144
144 -
 145
145 -
 146
146 -
 147
147 -
 148
148 -
 149
149 -
 150
150 -
 151
151 -
 152
152 -
 153
153 -
 154
154 -
 155
155 -
 156
156 -
 157
157 -
 158
158 -
 159
159 -
 160
160 -
 161
161 -
 162
162 -
 163
163 -
164
-
165
-
166
-
167
-
168
-
169
-
170
-
171
-
172
-
173
-
174
-
175
-
176
-
177
-
178
-
179
-
180
-
181
-
182
-
183
-
184
-
185
-
186
-
187
-
188
-
189
-
190
-
191
-
192
-
193
-
194
-
195
-
196
-
197
-
198
-
199
-
200
-
201
-
202
-
203
-
204
-
205
-
206
-
207
-
208
-
209
-
210
-
211
-
212
-
213
-
214
-
215
-
216
-
217
-
218
-
219
-
220
-
221
-
222
-
223
-
224
-
225
-
226
-
227
-
228
-
229
-
230
-
231
-
232
-
233
-
234
-
235
-
236
-
237
-
238
-
239
-
240
-
241
-
242
-
243
-
244
-
245
-
246
-
247
-
248
-
249
-
250
-
251
-
252
-
253
-
254
-
255
-
256
-
257
-
258
-
259
-
260
-
261
-
262
-
263
-
264
-
265
-
266
-
267
 |
 |

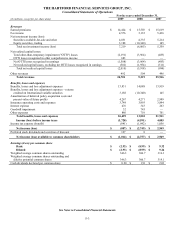
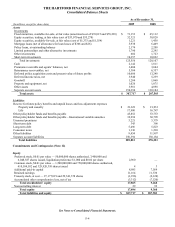
F-4
THE HARTFORD FINANCIAL SERVICES GROUP, INC.
Consolidated Balance Sheets
As of December 31,
(In millions, except for share data) 2009 2008
Assets
Investments
Fixed maturities, available-for-sale, at fair value (amortized cost of $76,015 and $78,238) $ 71,153 $ 65,112
Equity securities, trading, at fair value (cost of $33,070 and $35,278) 32,321 30,820
Equity securities, available-for-sale, at fair value (cost of $1,333 and $1,554) 1,221 1,458
Mortgage loans (net of allowances for loan losses of $366 and $26) 5,938 6,469
Policy loans, at outstanding balance 2,174 2,208
Limited partnerships and other alternative investments 1,790 2,295
Other investments 602 1,723
Short-term investments 10,357 10,022
Total investments 125,556 120,107
Cash 2,142 1,811
Premiums receivable and agents’ balances, net 3,404 3,604
Reinsurance recoverables, net 5,384 6,357
Deferred policy acquisition costs and present value of future profits 10,686 13,248
Deferred income taxes, net 3,940 5,239
Goodwill 1,204 1,060
Property and equipment, net 1,026 1,075
Other assets 3,981 4,898
Separate account assets 150,394 130,184
Total assets $ 307,717 $ 287,583
Liabilities
Reserve for future policy benefits and unpaid losses and loss adjustment expenses
Property and casualty $ 21,651 $ 21,933
Life 17,980 16,747
Other policyholder funds and benefits payable 45,852 53,753
Other policyholder funds and benefits payable – International variable annuities 32,296 30,799
Unearned premiums 5,221 5,379
Short-term debt 343 398
Long-term debt 5,496 5,823
Consumer notes 1,136 1,210
Other liabilities 9,454 11,997
Separate account liabilities 150,394 130,184
Total liabilities 289,823 278,223
Commitments and Contingencies (Note 12)
Equity
Preferred stock, $0.01 par value — 50,000,000 shares authorized, 3,400,000 and
6,048,387 shares issued, liquidation preference $1,000 and $0.02 per share
2,960
—
Common stock, $0.01 par value — 1,500,000,000 and 750,000,000 shares authorized,
410,184,182 and 329,920,310 shares issued
4
3
Additional paid-in capital 8,985 7,569
Retained earnings 11,164 11,336
Treasury stock, at cost — 27,177,019 and 29,341,378 shares (1,936) (2,120)
Accumulated other comprehensive loss, net of tax (3,312) (7,520)
Total stockholders’ equity 17,865 9,268
Noncontrolling interest 29 92
Total equity 17,894 9,360
Total liabilities and equity $ 307,717 $ 287,583
See Notes to Consolidated Financial Statements.