The Hartford 2009 Annual Report Download - page 184
Download and view the complete annual report
Please find page 184 of the 2009 The Hartford annual report below. You can navigate through the pages in the report by either clicking on the pages listed below, or by using the keyword search tool below to find specific information within the annual report.-
 1
1 -
2
-
3
-
4
-
5
-
6
-
7
-
8
-
9
-
10
-
11
-
12
-
13
-
14
-
15
-
16
-
17
-
18
-
19
-
20
-
21
-
22
-
23
-
24
-
25
-
26
-
27
-
28
-
29
-
30
-
31
-
32
-
33
-
34
-
35
-
36
-
37
-
38
-
39
-
40
-
41
-
42
-
43
-
44
-
45
-
46
-
47
-
48
-
49
-
50
-
51
-
52
-
53
-
54
-
55
-
56
-
57
-
58
-
59
-
60
-
61
-
62
-
63
-
64
-
65
-
66
-
67
-
68
-
69
-
70
-
71
-
72
-
73
-
74
-
75
-
76
-
77
-
78
-
79
-
80
-
81
-
82
-
83
-
84
-
85
-
86
-
87
-
88
-
89
-
90
-
91
-
92
-
93
-
94
-
95
-
96
-
97
-
98
-
99
-
100
-
101
-
102
-
103
-
104
-
105
-
106
-
107
-
108
-
109
-
110
-
111
-
112
-
113
-
114
-
115
-
116
-
117
-
118
-
119
-
120
-
121
-
122
-
123
-
124
-
125
-
126
-
127
-
128
-
129
-
130
-
131
-
132
-
133
-
134
-
135
-
136
-
137
-
138
-
139
-
140
-
141
-
142
-
143
-
144
-
145
-
146
-
147
-
148
-
149
-
150
-
151
-
152
-
153
-
154
-
155
-
156
-
157
-
158
-
159
-
160
-
161
-
162
-
163
-
164
-
165
-
166
-
167
-
168
-
169
-
170
-
171
-
172
-
173
-
 174
174 -
 175
175 -
 176
176 -
 177
177 -
 178
178 -
 179
179 -
 180
180 -
 181
181 -
 182
182 -
 183
183 -
 184
184 -
 185
185 -
 186
186 -
 187
187 -
 188
188 -
 189
189 -
 190
190 -
 191
191 -
 192
192 -
 193
193 -
 194
194 -
195
-
196
-
197
-
198
-
199
-
200
-
201
-
202
-
203
-
204
-
205
-
206
-
207
-
208
-
209
-
210
-
211
-
212
-
213
-
214
-
215
-
216
-
217
-
218
-
219
-
220
-
221
-
222
-
223
-
224
-
225
-
226
-
227
-
228
-
229
-
230
-
231
-
232
-
233
-
234
-
235
-
236
-
237
-
238
-
239
-
240
-
241
-
242
-
243
-
244
-
245
-
246
-
247
-
248
-
249
-
250
-
251
-
252
-
253
-
254
-
255
-
256
-
257
-
258
-
259
-
260
-
261
-
262
-
263
-
264
-
265
-
266
-
267
 |
 |

THE HARTFORD FINANCIAL SERVICES GROUP, INC.
NOTES TO CONSOLIDATED FINANCIAL STATEMENTS (continued)
F-35
5. Investments and Derivative Instruments (continued)
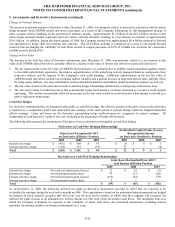
Credit Risk
The Company’ s derivative counterparty exposure policy establishes market-based credit limits, favors long-term financial stability and
creditworthiness and typically requires credit enhancement/credit risk reducing agreements. Credit risk is measured as the amount owed
to the Company based on current market conditions and potential payment obligations between the Company and its counterparties. For
each legal entity of the Company credit exposures are generally quantified daily, netted by counterparty and collateral is pledged to and
held by, or on behalf of, the Company to the extent the current value of derivatives exceeds the contractual thresholds which do not
exceed $10. The Company also minimizes the credit risk in derivative instruments by entering into transactions with high quality
counterparties rated A2/A or better, which are monitored and evaluated by the Company’ s risk management team and reviewed by
senior management. In addition, the Company monitors counterparty credit exposure on a monthly basis to ensure compliance with
Company policies and statutory limitations. The Company also maintains a policy of requiring that derivative contracts, other than
exchange traded contracts, certain currency forward contracts, and certain embedded derivatives, be governed by an International Swaps
and Derivatives Association Master Agreement which is structured by legal entity and by counterparty and permits right of offset.
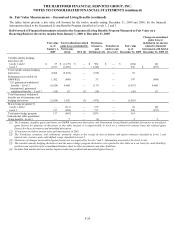
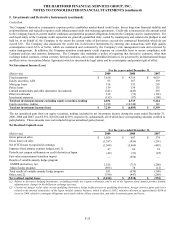
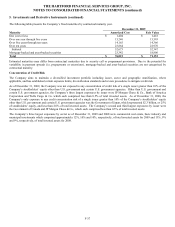
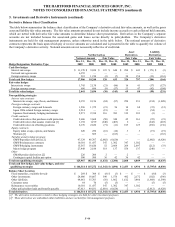
Net Investment Income (Loss)
For the years ended December 31,
(Before-tax) 2009 2008 2007
Fixed maturities $3,618 $ 4,310 $4,653
Equity securities, AFS 93 167 139
Mortgage loans 316 333 293
Policy loans 139 139 135
Limited partnerships and other alternative investments (341) (445) 255
Other investments 318 (72) (161)
Investment expenses (112) (97) (100)
Total net investment income excluding equity securities, trading 4,031 4,335 5,214
Equity securities, trading 3,188 (10,340) 145
Total net investment income (loss) $7,219 $ (6,005) $5,359
The net unrealized gain (loss) on equity securities, trading, included in net investment income during the years ended December 31,
2009, 2008 and 2007, was $3,391, $(9,626) and $(539), respectively, substantially all of which have corresponding amounts credited to
policyholders. These amounts were not included in gross unrealized gains (losses).
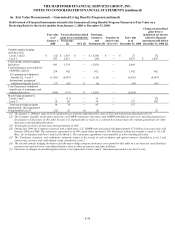
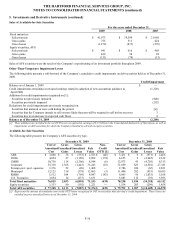
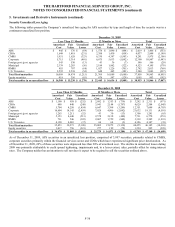
Net Realized Capital Losses
For the years ended December 31,
(Before-tax) 2009 2008 2007
Gross gains on sales $1,056 $ 607 $374
Gross losses on sales (1,397) (856) (291)
Net OTTI losses recognized in earnings (1,508) (3,964) (483)
Japanese fixed annuity contract hedges, net [1] 47 64 18
Periodic net coupon settlements on credit derivatives/Japan (49) (33) (25)
Fair value measurement transition impact — (650) —
Results of variable annuity hedge program
GMWB derivatives, net 1,526 (713) (286)
Macro hedge program (895) 74 (12)
Total results of variable annuity hedge program 631 (639) (298)
Other, net [2] (790) (447) (289)
Net realized capital losses $(2,010) $ (5,918) $(994)
[1] Relates to derivative hedging instruments, excluding periodic net coupon settlements, and is net of the Japanese fixed annuity product liability
adjustment for changes in the dollar/yen exchange spot rate.
[2] Consists of changes in fair value on non-qualifying derivatives, hedge ineffectiveness on qualifying derivatives, foreign currency gains and losses
related to the internal reinsurance of the Japan variable annuity business, which is offset in AOCI, valuation allowances, approximately $300 of
losses in 2009 related to contingent obligations associated with the Allianz transaction, and other investment gains and losses.