The Hartford 2009 Annual Report Download - page 92
Download and view the complete annual report
Please find page 92 of the 2009 The Hartford annual report below. You can navigate through the pages in the report by either clicking on the pages listed below, or by using the keyword search tool below to find specific information within the annual report.-
 1
1 -
2
-
3
-
4
-
5
-
6
-
7
-
8
-
9
-
10
-
11
-
12
-
13
-
14
-
15
-
16
-
17
-
18
-
19
-
20
-
21
-
22
-
23
-
24
-
25
-
26
-
27
-
28
-
29
-
30
-
31
-
32
-
33
-
34
-
35
-
36
-
37
-
38
-
39
-
40
-
41
-
42
-
43
-
44
-
45
-
46
-
47
-
48
-
49
-
50
-
51
-
52
-
53
-
54
-
55
-
56
-
57
-
58
-
59
-
60
-
61
-
62
-
63
-
64
-
65
-
66
-
67
-
68
-
69
-
70
-
71
-
72
-
73
-
74
-
75
-
76
-
77
-
78
-
79
-
80
-
81
-
 82
82 -
 83
83 -
 84
84 -
 85
85 -
 86
86 -
 87
87 -
 88
88 -
 89
89 -
 90
90 -
 91
91 -
 92
92 -
 93
93 -
 94
94 -
 95
95 -
 96
96 -
 97
97 -
 98
98 -
 99
99 -
 100
100 -
 101
101 -
 102
102 -
103
-
104
-
105
-
106
-
107
-
108
-
109
-
110
-
111
-
112
-
113
-
114
-
115
-
116
-
117
-
118
-
119
-
120
-
121
-
122
-
123
-
124
-
125
-
126
-
127
-
128
-
129
-
130
-
131
-
132
-
133
-
134
-
135
-
136
-
137
-
138
-
139
-
140
-
141
-
142
-
143
-
144
-
145
-
146
-
147
-
148
-
149
-
150
-
151
-
152
-
153
-
154
-
155
-
156
-
157
-
158
-
159
-
160
-
161
-
162
-
163
-
164
-
165
-
166
-
167
-
168
-
169
-
170
-
171
-
172
-
173
-
174
-
175
-
176
-
177
-
178
-
179
-
180
-
181
-
182
-
183
-
184
-
185
-
186
-
187
-
188
-
189
-
190
-
191
-
192
-
193
-
194
-
195
-
196
-
197
-
198
-
199
-
200
-
201
-
202
-
203
-
204
-
205
-
206
-
207
-
208
-
209
-
210
-
211
-
212
-
213
-
214
-
215
-
216
-
217
-
218
-
219
-
220
-
221
-
222
-
223
-
224
-
225
-
226
-
227
-
228
-
229
-
230
-
231
-
232
-
233
-
234
-
235
-
236
-
237
-
238
-
239
-
240
-
241
-
242
-
243
-
244
-
245
-
246
-
247
-
248
-
249
-
250
-
251
-
252
-
253
-
254
-
255
-
256
-
257
-
258
-
259
-
260
-
261
-
262
-
263
-
264
-
265
-
266
-
267
 |
 |

92
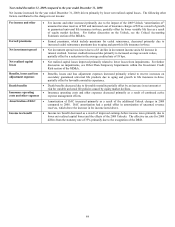
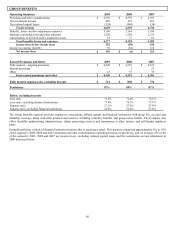
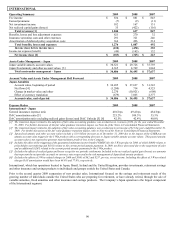
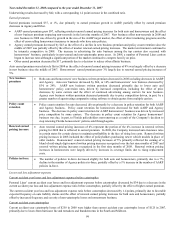
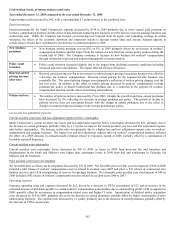
Year ended December 31, 2008 compared to the year ended December 31, 2007
Net income decreased for the year ended December 31, 2008 as a result of the 2008 Unlock versus the 2007 Unlock along with
increased realized capital losses from the adoption of fair value guidance, which resulted in a net realized capital loss of $34 during the
first quarter of 2008, impact of the 3 Win trigger, impairment charges, increases in insurance operating costs and other expenses,
partially offset by an increase in fee income. Due to significant market declines in the fourth quarter of 2008, approximately 97% of the
Company’ s in-force 3 Win policies, or $3.1 billion in account value, had triggered the associated GMIB. 3 Win is a variable annuity
product that was offered in Japan with a GMIB and GMAB rider. The GMIB trigger occurred as a result of policyholder account values
falling below 80% of their initial deposit. As a result of the GMIB trigger, the majority of the Company’ s 3 Win policies annuitized or
surrendered free of charge in the fourth quarter of 2008. For further discussion on the Unlock, see Unlocks within the Critical
Accounting Estimates section of the MD&A. For further discussion of the fair value guidance transition impact, see Note 4a of the
Notes to Consolidated Financial Statements. The following other factors contributed to the changes in net income:
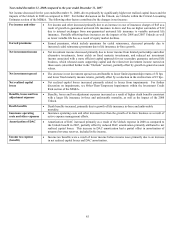
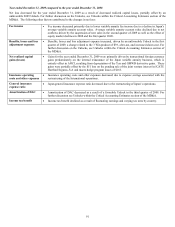
Fee income • Fee income increased primarily due to growth in Japan’ s variable annuity average assets under
management. The increase in average assets under management over the prior year was driven by
deposits of $3.0 billion and a $6.6 billion increase due to foreign currency exchange translation as the
yen strengthened compared to the U.S. dollar. Deposits and favorable foreign currency exchange
were offset by unfavorable market performance of $10.9 billion. Net flows have decreased in Japan
annuities due the 3 Win trigger and to increased competition from domestic and foreign insurers,
particularly competition relating to products offered with living benefit guarantees.
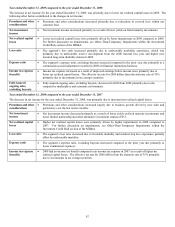
Benefits, losses and loss
adjustment expenses
• Benefits, losses and loss adjustment expense increased as a result of the impacts of the Unlock in the
third quarter of 2008 as compared to the third quarter of 2007, the impact of the 3 Win trigger, as
well as higher GMDB net amount at risk and increased claims costs.
Net realized capital
gains (losses)
• Losses for the year ended December 31, 2008 were primarily driven by transactional foreign
currency losses predominately on the internal reinsurance of the Japan variable annuity business,
which is entirely offset in AOCI, resulting from appreciation of the Yen, fair value measurement
transition and impairments.
Insurance operating
costs and other expenses
• Insurance operating costs and other expenses increased due to the growth and strategic investment in
the Japan and Other International operations, as well as lower capitalization of deferred policy
acquisition costs, as acquisition costs exceeded pricing allowables.
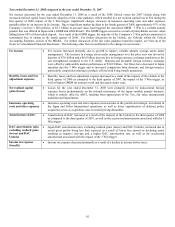
Amortization of DAC • Amortization of DAC increased as a result of the impacts of the Unlock in the third quarter of 2008
as compared to the third quarter of 2007, as well as the accelerated amortization associated with the 3
Win trigger.
DAC amortization ratio,
excluding realized gains
(losses) and DAC
Unlocks
• Japan DAC amortization ratio, excluding realized gains (losses) and DAC Unlocks, increased due to
actual gross profits being less than expected as a result of lower fees earned on declining assets
resulting in negative true-ups and a higher DAC amortization rate, as well as the accelerated
amortization associated with the impact of the 3 Win trigger.
Income tax expense
(benefit)
• Income tax expense decreased primarily as a result of a decline in income before taxes.