The Hartford 2009 Annual Report Download - page 76
Download and view the complete annual report
Please find page 76 of the 2009 The Hartford annual report below. You can navigate through the pages in the report by either clicking on the pages listed below, or by using the keyword search tool below to find specific information within the annual report.-
 1
1 -
2
-
3
-
4
-
5
-
6
-
7
-
8
-
9
-
10
-
11
-
12
-
13
-
14
-
15
-
16
-
17
-
18
-
19
-
20
-
21
-
22
-
23
-
24
-
25
-
26
-
27
-
28
-
29
-
30
-
31
-
32
-
33
-
34
-
35
-
36
-
37
-
38
-
39
-
40
-
41
-
42
-
43
-
44
-
45
-
46
-
47
-
48
-
49
-
50
-
51
-
52
-
53
-
54
-
55
-
56
-
57
-
58
-
59
-
60
-
61
-
62
-
63
-
64
-
65
-
 66
66 -
 67
67 -
 68
68 -
 69
69 -
 70
70 -
 71
71 -
 72
72 -
 73
73 -
 74
74 -
 75
75 -
 76
76 -
 77
77 -
 78
78 -
 79
79 -
 80
80 -
 81
81 -
 82
82 -
 83
83 -
 84
84 -
 85
85 -
 86
86 -
87
-
88
-
89
-
90
-
91
-
92
-
93
-
94
-
95
-
96
-
97
-
98
-
99
-
100
-
101
-
102
-
103
-
104
-
105
-
106
-
107
-
108
-
109
-
110
-
111
-
112
-
113
-
114
-
115
-
116
-
117
-
118
-
119
-
120
-
121
-
122
-
123
-
124
-
125
-
126
-
127
-
128
-
129
-
130
-
131
-
132
-
133
-
134
-
135
-
136
-
137
-
138
-
139
-
140
-
141
-
142
-
143
-
144
-
145
-
146
-
147
-
148
-
149
-
150
-
151
-
152
-
153
-
154
-
155
-
156
-
157
-
158
-
159
-
160
-
161
-
162
-
163
-
164
-
165
-
166
-
167
-
168
-
169
-
170
-
171
-
172
-
173
-
174
-
175
-
176
-
177
-
178
-
179
-
180
-
181
-
182
-
183
-
184
-
185
-
186
-
187
-
188
-
189
-
190
-
191
-
192
-
193
-
194
-
195
-
196
-
197
-
198
-
199
-
200
-
201
-
202
-
203
-
204
-
205
-
206
-
207
-
208
-
209
-
210
-
211
-
212
-
213
-
214
-
215
-
216
-
217
-
218
-
219
-
220
-
221
-
222
-
223
-
224
-
225
-
226
-
227
-
228
-
229
-
230
-
231
-
232
-
233
-
234
-
235
-
236
-
237
-
238
-
239
-
240
-
241
-
242
-
243
-
244
-
245
-
246
-
247
-
248
-
249
-
250
-
251
-
252
-
253
-
254
-
255
-
256
-
257
-
258
-
259
-
260
-
261
-
262
-
263
-
264
-
265
-
266
-
267
 |
 |

76
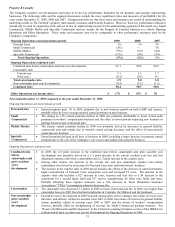
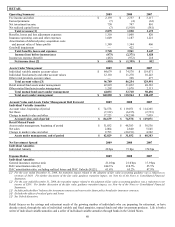
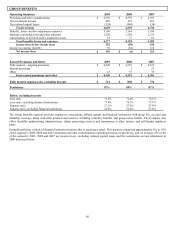
Other Operations net income (loss)
• Other Operations reported a lower net loss in 2009 as compared to 2008 primarily due to a decrease in net realized capital losses
and a decrease in the allowance for uncollectible reinsurance as a result of the Company’ s annual evaluation of reinsurance
recoverables. Partially offsetting these drivers was an increase in net unfavorable prior accident year reserve development and a
decrease in net investment income. See the Other Operations segment MD&A for further discussion.
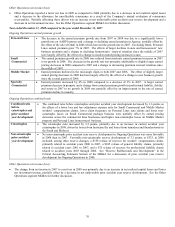
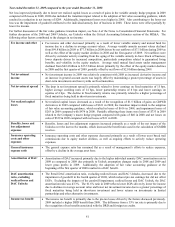
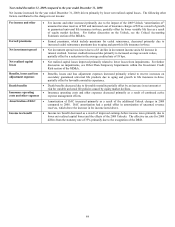
Year ended December 31, 2008 compared to the year ended December 31, 2007
Ongoing Operations earned premium growth
Personal Lines • The decrease in the earned premium growth rate from 2007 to 2008 was due to a significantly lower
growth rate on AARP business and a change to declining earned premium in Agency, partially offset by
the effect of the sale of Omni in 2006 which lowered the growth rate in 2007. Excluding Omni, Personal
Lines earned premium grew 7% in 2007. The effects of larger declines in auto and homeowners’ new
business premium and a change to declining homeowners’ renewal retention since the middle of 2007
were largely offset by the effect of a change to modest earned pricing increases in auto.
Small
Commercial
• The earned premium growth rate in 2008 was reduced from moderate earned premium increases in 2007
to no growth in 2008. The decrease in the growth rate was primarily attributable to slightly larger earned
pricing decreases in 2008 compared to 2007 and a change to decreasing premium renewal retention since
the middle of 2007.
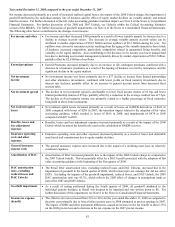
Middle Market • Earned premium declined in the mid-single digits in both 2007 and 2008. The effect of slightly larger
earned pricing decreases in 2008 has been largely offset by the effect of a change to new business growth
since the second quarter of 2008.
Specialty
Commercial
• Earned premium decreased by 4% in 2008 compared to a decrease of 3% in 2007. A larger earned
premium decrease in property and a change from earned premium growth in professional liability, fidelity
and surety in 2007 to no growth in 2008 was partially offset by an improvement in the rate of earned
premium decline in casualty.
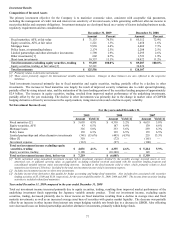
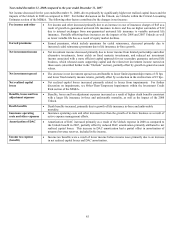
Ongoing Operations combined ratio
Combined ratio
before
catastrophes and
prior accident
year development
• The combined ratio before catastrophes and prior accident year development decreased by 1.6 points as
the effects of a lower loss and loss adjustment expense ratio for Small Commercial and Middle Market
workers’ compensation claims, lower claim frequency on Personal Lines auto claims and lower non-
catastrophe losses on Small Commercial package business were partially offset by earned pricing
decreases across the commercial lines businesses and higher non-catastrophe losses on Middle Market
property and Personal Lines homeowners’ business.
Catastrophes • The catastrophe ratio increased by 3.2 points, primarily due to an increase in current accident year
catastrophes in 2008, driven by losses from hurricane Ike and losses from tornadoes and thunderstorms in
the South and Midwest.
Non-catastrophe
prior accident
year development
• Net non-catastrophe prior accident year reserve development in Ongoing Operations was more favorable
in 2008 than in 2007. Favorable non-catastrophe reserve development of 3.2 points, or $333, in 2008
included, among other reserve changes, a $156 release of reserves for workers’ compensation claims,
primarily related to accident years 2000 to 2007, a $105 release of general liability claims, primarily
related to accident years 2001 to 2007, and a $75 release of reserves for professional liability claims
related to accident years 2003 through 2006. See “Reserve Rollforwards and Development” in the
Critical Accounting Estimates Section of the MD&A for a discussion of prior accident year reserve
development for Ongoing Operations in 2008.
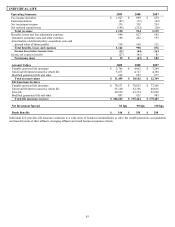
Other Operations net income (loss)
• The change from net income in 2007 to a net loss in 2008 was primarily due to an increase in net realized capital losses and lower
net investment income, partially offset by a decrease in net unfavorable prior accident year reserve development. See the Other
Operations segment MD&A for further discussion.