The Hartford 2009 Annual Report Download - page 74
Download and view the complete annual report
Please find page 74 of the 2009 The Hartford annual report below. You can navigate through the pages in the report by either clicking on the pages listed below, or by using the keyword search tool below to find specific information within the annual report.-
 1
1 -
2
-
3
-
4
-
5
-
6
-
7
-
8
-
9
-
10
-
11
-
12
-
13
-
14
-
15
-
16
-
17
-
18
-
19
-
20
-
21
-
22
-
23
-
24
-
25
-
26
-
27
-
28
-
29
-
30
-
31
-
32
-
33
-
34
-
35
-
36
-
37
-
38
-
39
-
40
-
41
-
42
-
43
-
44
-
45
-
46
-
47
-
48
-
49
-
50
-
51
-
52
-
53
-
54
-
55
-
56
-
57
-
58
-
59
-
60
-
61
-
62
-
63
-
 64
64 -
 65
65 -
 66
66 -
 67
67 -
 68
68 -
 69
69 -
 70
70 -
 71
71 -
 72
72 -
 73
73 -
 74
74 -
 75
75 -
 76
76 -
 77
77 -
 78
78 -
 79
79 -
 80
80 -
 81
81 -
 82
82 -
 83
83 -
 84
84 -
85
-
86
-
87
-
88
-
89
-
90
-
91
-
92
-
93
-
94
-
95
-
96
-
97
-
98
-
99
-
100
-
101
-
102
-
103
-
104
-
105
-
106
-
107
-
108
-
109
-
110
-
111
-
112
-
113
-
114
-
115
-
116
-
117
-
118
-
119
-
120
-
121
-
122
-
123
-
124
-
125
-
126
-
127
-
128
-
129
-
130
-
131
-
132
-
133
-
134
-
135
-
136
-
137
-
138
-
139
-
140
-
141
-
142
-
143
-
144
-
145
-
146
-
147
-
148
-
149
-
150
-
151
-
152
-
153
-
154
-
155
-
156
-
157
-
158
-
159
-
160
-
161
-
162
-
163
-
164
-
165
-
166
-
167
-
168
-
169
-
170
-
171
-
172
-
173
-
174
-
175
-
176
-
177
-
178
-
179
-
180
-
181
-
182
-
183
-
184
-
185
-
186
-
187
-
188
-
189
-
190
-
191
-
192
-
193
-
194
-
195
-
196
-
197
-
198
-
199
-
200
-
201
-
202
-
203
-
204
-
205
-
206
-
207
-
208
-
209
-
210
-
211
-
212
-
213
-
214
-
215
-
216
-
217
-
218
-
219
-
220
-
221
-
222
-
223
-
224
-
225
-
226
-
227
-
228
-
229
-
230
-
231
-
232
-
233
-
234
-
235
-
236
-
237
-
238
-
239
-
240
-
241
-
242
-
243
-
244
-
245
-
246
-
247
-
248
-
249
-
250
-
251
-
252
-
253
-
254
-
255
-
256
-
257
-
258
-
259
-
260
-
261
-
262
-
263
-
264
-
265
-
266
-
267
 |
 |
74
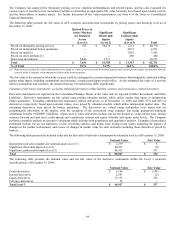
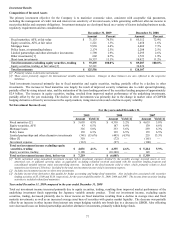
Year ended December 31, 2008 compared to year ended December 31, 2007
• The decrease in Individual Annuity’ s ROA, excluding realized losses and the effect of the DAC Unlock, reflects the write-off of
goodwill of $274 after-tax, or 19.4 bps; lower limited partnership and other alternative investment income; and the net effect of
lower fees.
• The decrease in Individual Life’ s after-tax margin, excluding realized losses and the effect of the DAC Unlock, was primarily due
to unfavorable mortality expense, partially offset by a lower effective tax rate.
• The decrease in Retirement Plans ROA, excluding realized losses and the effect of the DAC Unlock, was primarily driven by an
increase in assets under management due to the acquired rights to service $18.7 billion in mutual funds, comprised of $15.8 billion
in mutual funds from Sun Life Retirement Services, Inc., and $2.9 billion in mutual funds from Princeton Retirement Group, both
of which closed in the first quarter of 2008. The acquired blocks of assets produce a lower ROA as they are comprised of mutual
fund assets and assets under management as opposed to traditional annuity contracts. Also contributing to the decrease was lower
yields on fixed maturity investments and a decline in limited partnership and other alternative investment income, higher service
and technology costs and additional expenses associated with the acquisitions. Partially offsetting these decreases were tax benefits
primarily associated with DRD.
• The Group Benefit increase in after-tax margin was primarily due to the favorable expense ratio.
• International-Japan ROA, excluding realized gains (losses) and the effect of the DAC Unlock, declined due to lower earned fees as
a result of declining account values, lower surrender fees due to a reduction in lapses and an increase in the DAC amortization rate
due to lower actual gross profits, as well as the accelerated DAC amortization associated with the 3 Win trigger.
• The decrease in Institutional’ s ROA, excluding realized losses, is primarily due to a decline in limited partnership and other
alternative investment income. The decrease is also due to unfavorable mortality and lower yields on fixed maturity investments.